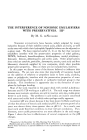
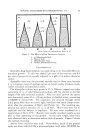
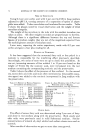
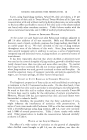
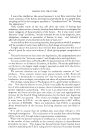
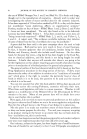
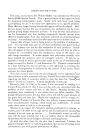
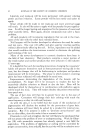
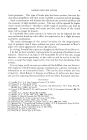
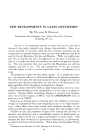
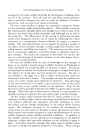
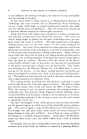
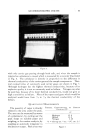
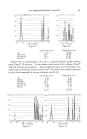
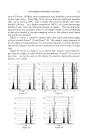
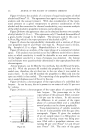
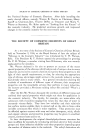
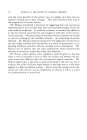
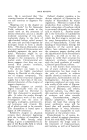
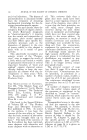
GAS CHROMATOGRAPHIC ANALYSIS 101 40 20- i I I I I I • I I I I I I I I ] I I 25 •0 1• lO TIME IN MINUTES Figure 9. lOO 8o 60 m __ ,,0, Z •-0 Q. i,, ! I-- gd -• 20 • 0 j- Illl= 0 • I/U VIM 1 • r i i i i i i • i i i i lO 5 0 TIME IN MINUTES •igure lO. Volume Per Cent Weight Per Cent Air 0.12 0. 025 Freon© 12 39.9 34.50 Freon© 114 26.6 32.60 Freon© 11 33.5 32.90 Figure 10 is a chromatogram of a 2.0 cc. vaporized liquid sample of pro- pane, Freon © 12 solution. It also shows that traces of air, ethane, Freon © 114 and butane were present. The sample had been unintentionally con- taminated with ethane, butane and Freon © 114, which were readily detected in the chromatograph by using maximum sensitivity. Volume Per Cent Weight Per Cent Air 0.33 0.15 Ethane 0.13 0.06 Propane 72.4 50.00 Freon© 12 25.0 47.75 Freon© 114 0.20 0.54 Butane 1.89 1.73 99.95 100.23 i i i i i i i i i [ i i i i [ i i [ ] [ i [ i i I [ I I 100 lOO i 80 I 60 , 40 20-- 25 •0 iillrlllllllrlrlll]11 • • ill[ 25 2O 15 10 --z c9 _ t/[JI • , , I • , I 5 0 TIME IN MINUTES Figure 11. Figure 12.

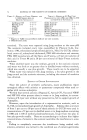
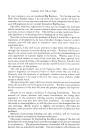
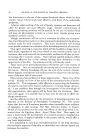
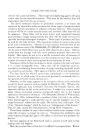
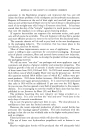
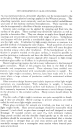
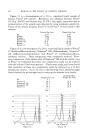
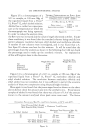
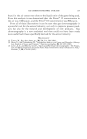
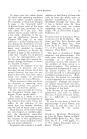
102 JOURNAL OF THE SOCIETY OF COSMETIC CHEMISTS Figure 11 is a chromatogram of a 2.0 cc. vaporized liquid sample of butane, Freon © 114 solution. Resolution was adequate between Freon © 114 (b.p. 38.4øF.) and butane (b.p. 21.2øF.) and, again, impurities due to contamination of the sample were detected by using maximum sensitivity. Traces of air, ethane, propane, Freon © 12 and Freon © 11 were found in this Volume Per Cent Weight Per Cent Air 0.25 0.07 Ethane Trace Trace Propane 0.98 0.42 Freon© 12 2.65 3.14 Freon© 114 37.8 63.00 Butane 57.8 32.78 Freon© 11 0.44 0.59 solution. Figure 12 is a chromatogram of a 2.0 cc. vaporized liquid sample of Freon © 12 (dichlorodifluoromethane), Genetron © 100 (difluoroethane), Genetron © 101 (difluoromonochloroethane) and Freon © 11 (trichloromonofluoro- methane) solution. These components were completely resolved. How- ever, comparison of the elution time of Genetron © 100 with the elution time of Freon © 114 indicated that these two components would not be resolved with this column if both were present. Checks were made, and it was found that resolution of these two components could be obtained on a 12-foot hexadecane column. As can be seen in the following chart, the percentages found checked the percentages used to make up the mixture very closely. Synthetic Mix, Weight Per Cent Weight Per Cent Air 0.1 .. Freon© 12 24.5 25.0 Genetron© 100 25.3 25.0 Genetron© 101 25.7 25.0 Freon© 11 24.9 25.0 100.5 rllrl[11111111ll[11 • i 100 • -- 60 -- 0 TIME IN MINUTES Figure 13. •oo I--.-I uJ-r 80 II L 0 •-- 40 '• I I ,,, o I I r• _ I I I I I I , , I , I I I I : I I I ] I I l 20 •5 •0 5 0 T:ME IN MINUTES Figure 14.
Purchased for the exclusive use of nofirst nolast (unknown)
From: SCC Media Library & Resource Center (library.scconline.org)