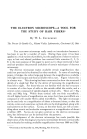
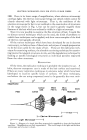
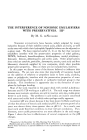
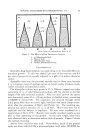
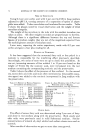
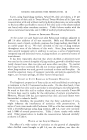
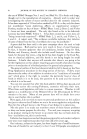
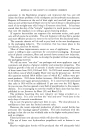
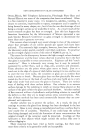
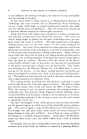
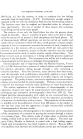
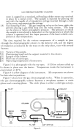
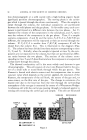
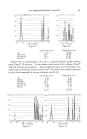
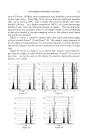
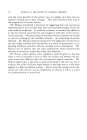
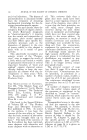
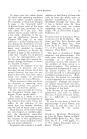
GAS CHROMATOGRAPHIC ANALYSIS Figure 6. with only carrier gas passing through both cells, and when the sample is injected an unbalance is caused which is measured by a recorder illustrated in Fig. 6. The unbalance is directly in proportion to the difference in thermal conductivity of the carrier gas and the sample components. Ther- mal conductivities of commonly used carrier gases are shown in Fig. 7. Although hydrogen has the highest thermal conductivity, because of its explosive quality it is not as commonly used as helium. Nitrogen can also be used but, because of its lower thermal conductivity, would not give as high a sensitivity as helium. Most of the vapors and gases which would be analyzed would have from •/• to t,/i0 the thermal conductivity of the helium. QUANTITATIVE The quantity of vapor is directly related to the area under the peak. The area can be measured by means of a planimeter, by cutting out the peak shape on suitable paper and weighing, or for routine analysis, by coupling an automatic integrator to the detector output. Peak areas may MEASUREMENTS THERMAL CONDUCTIVITIES GASES AT 0øC. OF CARRIER k* Hydrogen 15.9 Helium 13.9 Nitrogen 2.28 * k = kilo-erg cm. •'• sec.- • (øC. cm. •) -• Figure 7.

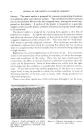
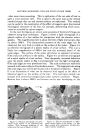
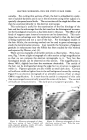
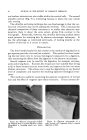
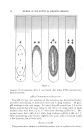
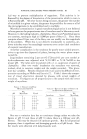
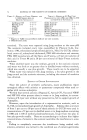
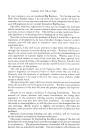
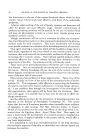
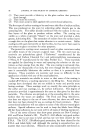
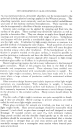
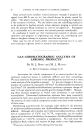
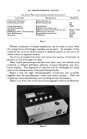
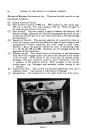
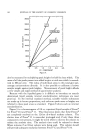
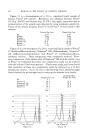
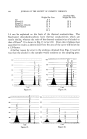
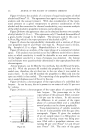
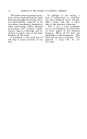
100 JOURNAL OF THE SOCIETY OF COSMETIC CHEMISTS 3600 $200 2800 2400 2000 1600 1200 8OO 4OO FREON 12 0 0 0.5 1.0 1.5 2.0 2.5 CC. COMPONENT Figure 8. also be measured by multiplying peak heights by half the base width. The areas of all the peaks present are added to give a total area which is normal- ized to 100 per cent. The ratios of individual areas to this total give per- centage concentrations directly. It is also possible to calibrate a known sample weight against peak heights. Measurement of peak height affords a very simple and rapid method of quantitative analysis. Because with the liquefied gases it is difficult to introduce an exactly determined liquid sample, internal standardization techniques are most practical. In the internal standard method, suitable volatile substances are made up in known proportions, and unknown peak areas or heights are referred to these peak areas as standard. Figure 8 shows such an internal standardization. Figure 9 is a chromatogram of 2.0 cc. vaporized liquid sample of Freon © 12, Freon © 114 and Freon © 11. This illustration shows that these Freons © are completely resolved on the 12-foot di-n-butyl maleate column. The elution time of Freon © 11 is somewhat prolonged and, if only these three components were present, it might be worth while to shorten the column to reduce the analysis time. The analysis time could be reduced to about fifteen minutes if an 8-foot column were being used. This column should still provide adequate resolution between Freon © 1:2 and Freon © 114.
Purchased for the exclusive use of nofirst nolast (unknown)
From: SCC Media Library & Resource Center (library.scconline.org)