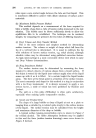
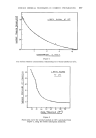
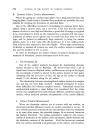
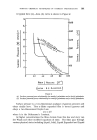
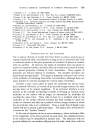
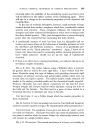
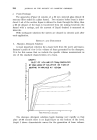
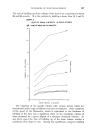
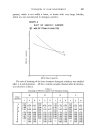
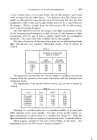
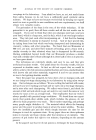
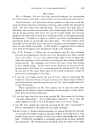
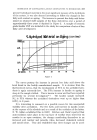
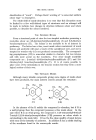
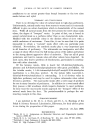
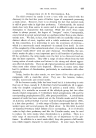
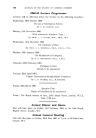
404 JOURNAL OF THE SOCIETY OF COSMETIC CHEMISTS the Critical Micelie Concentration level influence the properties of the foam to a greater extent than at much higher levels of concentration. GRAPH 6 PLOT OF LOSS FACTOR V/$ AGE OF FOAM IN MINUTES 20 9' u U) 5. o AGEOF FOAM IN MINUTES Toothpaste foams, with the exception of 30% CS foam, degenerate much more quickly than shampoo foams. PD/1, whose initial viscosity (at 20 seconds) is 228 centistokes, degrades to 50 centistokes after 5 minutes. The super foam state of CS is very short. This is observed easily as the foam is seen to start degrading very quickly as soon as the mixing stops until the resulting creamy foam appears stable. PD/1, the high roamer which gives

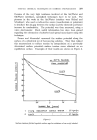
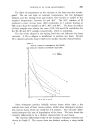
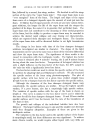
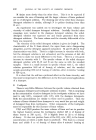
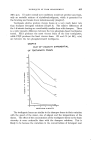
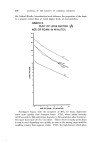
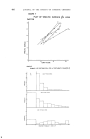
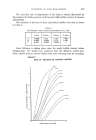
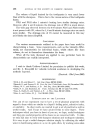
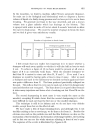
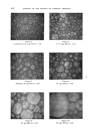
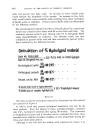
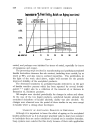
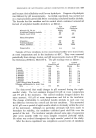
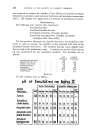
TECHNIQUES OF FOAM MEASUREMENT 405 a very viscous foam, is in a super foam state for 5{ minutes--more than twice as long as for the other foams. This indicates that PD/1 foams very easily as, although the same amount of work has been put into the four toothpastes, PD/I's foam has enough energy stored to be a super foam for $I minutes. PD/2 is a super foam for 140 seconds, CD for 100 seconds, and CS for 40 seconds (Graph $). The only difference between the shapes of the light transmission curves. of the toothpaste and shampoos is that the rate of the increase in light transmission with the age of foam is slightly higher with the toothpastes. (Graph 6). The super foam state is clearly seen in these graphs. The time of existence of the super foam state can be deduced from both light transmission and viscosity differential results. This is shown in Table $. Table 3 Duration of super foam state in seconds Light Viscosity Toothpaste transmission differential PD/1 315 300 PD/2 150 155 CD 140 125 CS 40 30 The agreement between the two sets of results is excellent, and proves beyond doubt the presence of the super foam state with the shampoo and toothpaste foams. The degradation of the specific surface with the age of foam is shown in Table 4. Table •l Time PD/1 PD/2 CD 30 seconds 2.79 2.80 2.88 1 minute 2.53 -- 2.43 2 minutes 2-15 2.33 2.40 3 minutes 1.67 2-06 2-08 4 minutes -- 1.98 1.83 5 minutes 1.42 1.76 1.72 Although the specific surface is very similar initially, it lS seen that PD/1 degrades much more rapidly. The plot of the specific surface vs. light transmission at given times is a straight line (Graph 7). Thus the. light transmission results can again be expressed in terms of specific surface. There is great variation in the size of the bubbles in the foam. The. distribution curve of a PD/1 foam is shown in Graph 8.
Purchased for the exclusive use of nofirst nolast (unknown)
From: SCC Media Library & Resource Center (library.scconline.org)