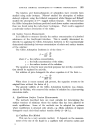
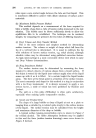
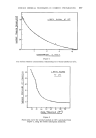
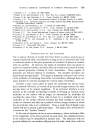
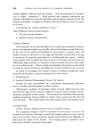
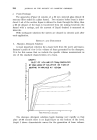
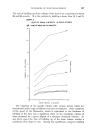
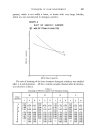
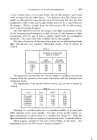
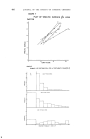
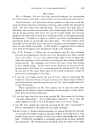
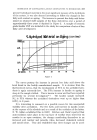
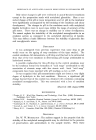
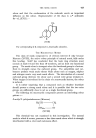
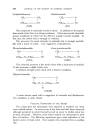
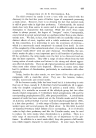
406 JOURNAL OF THE SOCIETY OF COSMETIC CHEMISTS GRAPH 7 PLOT OF SPECIFIC SURFACE V/S LOSS FACTOR M c. , 20 •1•3 LOSS FACTOR GRAPH 6 BUBBLE $•ZF. DISTRIBUTION FOR A TOOTHPASTE FoAM i1• •o- ,o ,•o ,o AGE OF FOAM 2 MINS I I DIAMETER OF

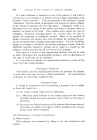
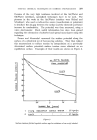
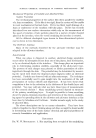
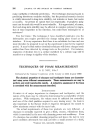
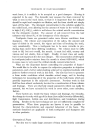
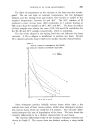
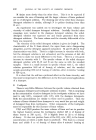
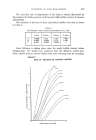
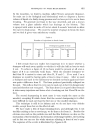
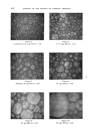
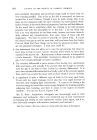
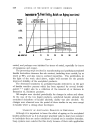
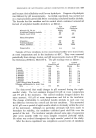
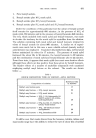
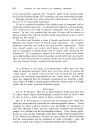
TECHNIQUES OF FOAM MEASUREMENT 407 The very fast rate of degradation of the foam is clearly illustrated by the number of bubbles present at 30 seconds (186 bubbles) and at 5 minutes (43 bubbles). The variation of the area of three individual bubbles with time is shown in Table $. Table $ CD Bubbles--area of individual bubbles in sq. cms. l min. 3mins. 5mins. 8mins. A. 0.0566 0.113 0.150 0.169 B. 0.0267 0.0780 0.113 0.156 C. 0.0011 0.0004 0.0002 -- Some diffusion is taking place since the small bubble shrinks before disappearing. We would have expected that the diffusion would have been a slower process, and we believe that some bursting must be occurring. G •APl..I 9. RATE OF DRAINING OF MOTHER LIQUORS s •o AGE OF FOAM IN MINUTES
Purchased for the exclusive use of nofirst nolast (unknown)
From: SCC Media Library & Resource Center (library.scconline.org)