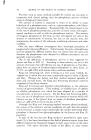
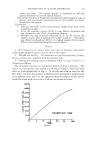
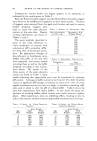
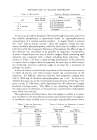
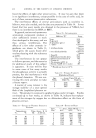
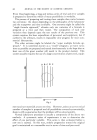
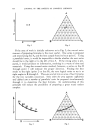
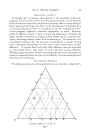
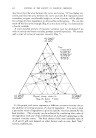
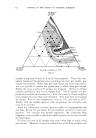
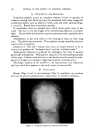
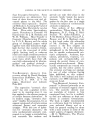
466 JOURNAL OF THE SOCIETY OF COSMETIC CHEMISTS output can be greatly increased, both by applying the principle of crossed series and paralleled series samples in the proper order, and by improving its methods of recording test results. The method proposed in this paper increases the assurance that all work done is purposeful, leading toward a desired goal with a minimum of random effort. Interpreting data from records normally kept in cosmetic product de- velopment is limited by their two dimensional character. For example a single point on a typical XY axis chart can only relate the two variables X and Y simultaneously as in Fig. 3. Our approach to this problem uses a ternary diagram in the form of an equilateral triangle to record test results more clearly. In this system, one point relates three variables simul- taneously as shown in Fig. 4. For the sake of clarity let us first review the properties of such diagrams. Emtdsifier IOO% Wa•er 10o% Oil Io0% Fig. 8 The vertices, ,4, B and C of the triangle can each represent 100 per cent of a given variable. The side B-C represents various ratios of "B" and "C" but excludes variable "A" entirely. Any line parallel to the side B-C represents a cbntant ratio of "A" combined with varying ratios of "B" and "C." The closer this parallel line appears to vertex ",4," the greater is the proportion of"A" until a maximum of 100 per cent is reached.

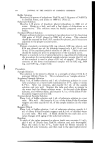
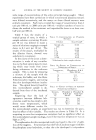
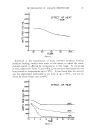
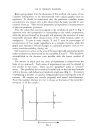
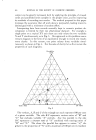
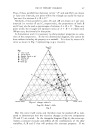
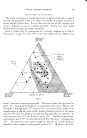
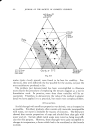
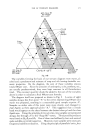
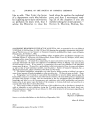
USE OF TERNARY DIAGRAMS 467 Thus, if these parallel lines (between vertex "A"' and side B-C) are drawn at 1 per cent intervals, any point within the triangle can easily be read as "per cent A in mixture A q- B q- C." Similarly, if lines parallel to sides A'C and A'B are drawn at 1 per cent intervals (to vertices B and C, respectively), the proportions of both B and C may also be read as percentages of mixture A' q- B q- C. Thus, any point within the triangle will repr.esent ratios of A' q- B q- C which total 100 per cent, the formula for that point. In formulation work it is necessary to relate product properties to varia- tions of the components. In the two dimensional diagram, this cannot be done without including the property as a variable. It is done by means of a curve as shown in Fig. 5 representing, (e.g.), viscosity. ,%ap-OJl •ooo• A D Alcohol-100% Phya,c•l cM.!ies relaf,ve to B Water-•oo% Soap-0il, Alcohol , WQf. r. Fig. 9 But this curve itself varies and therefore must be marked off as indi- cated to demonstrate how the viscosity changes as the two components (X and Y) are varied. In the triangular diagram (Fig. 6), the curve rep- resents a constant viscosity and defines all the combinations of the three variables, A, B and C that wi}l produce this constant property. If we
Purchased for the exclusive use of nofirst nolast (unknown)
From: SCC Media Library & Resource Center (library.scconline.org)