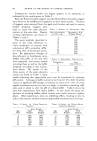
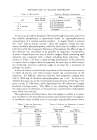
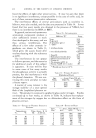
DETERMINATION OF ALKALINE PHOSPHATASE 447 TABLE 5--BuvvEk PH Assay Found, pH Units/100 ml. 9.6 1392 10.1 (normal) 1818 10.6 1634 TABLE 6--BurrE•t COMPOSITION Buffer Assay 0.1 M carbonate (control) 1681 0.05 M carbonate 1704 0.0! M carbonate 1668 0.01 M phosphate 93 0.05 M carbonate, 0. 005 M phosphate 591 In the assay procedure the phenol liberated through enzymatic activity of the alkaline phosphatase is determined finally by spectrophotometric measurement of a colored reaction product. A reagent blank is used as the "zero" optical density control. Since the reagents include the sub- strate, disodium phenylphosphate, which by itself may be subject to slow hydrolysis with the consequent liberation of free phenol, the effect of age of the substrate was considered to be possibly an important consideration. A series of experiments was run, in which a reagent blank containing aged substrate was compared with a blank including fresh substrate. The results, in Table 7, do show a rapid enough deterioration of the substrate to require that a reagent blank be prepared for each da, y on which assays are conducted, and that substrate ought to be kept for a maximum of perhaps two weeks. A series of assays was performed on portions of the same placenta extract, in which all factors were held constant except the concentration of the substrate. Six different substrate solutions were prepared, ranging from 1.09 to 109.0 rag. of disodium phenylphosphate per 5 ml. As shown in Table 8, the assay run at the recommended concentration of 10.9 rag./5 ml. gave a result of 1706 units, while departing from this substrate strength produced varying results. This effect is not surprising, but emphasizes the importance of adherence to the particular concentration of phosphate ester which was selected. The experiments described above show the degree to which it is neces- sary to adhere to the prescribed procedures and concentrations of reagents. A satisfactory assay method nmst of course give reproducible results over a TABLE 7--AOE Or SUBSTKATE Blank Analysis TAULE 8--EffECT or SUBSTKATE CONCEN- TKATION 0 0.000 109.0 2634 7 0.0058 21.8 2174 18 0.0075 10.9' 1706' 2• 0.0235 5.45 1205 40 0.073 2.18 786 60 0.210 1.09 475 72 0.385 * Specified in method. Age, Phenol, Concentration, Assay, Days Mg./5 ml. Mg./5 ml. Units/100 ml.

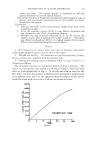
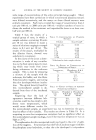
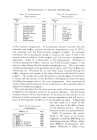
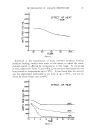
448 JOURNAL OF THE SOCIETY OF COSMETIC CHEMISTS wide range of concentrations of the active principle being sought. Many experiments have been carried out in which concentrated placenta extracts were diluted successively, and the assays on these diluted extracts were entirely consistent. Such tests covered the range of concentration from 1 unit per 100 ml. to 2600 units per 100 mi.---smaller numbers of tests in- dicate the method to be consistent and reproducible down to at least one- half unit per 100 mi. Table 9 lists the results of a typical group of tests, in which a sample solution containing 10 units per 10 mi. was diluted to make a series of solutions rangingin strength down to 0.1 unit per 10 mi. The results of the assays, multiplied by the dilution factor, showed very satisfactory consistency. In the course of the assay a deter- mination is made of any contribu- tion to the final optical density read- ing which may result from inter- fering substances in the unknown sample. This is done by preparing a mixture of the sample with the substrate, the buffer, and the dilute Folin-Ciocalteu reagent, and noting the color developed without incuba- tion. The optical density found for this nonincubated sample is de- ducted from that of the incubated sample. Suspecting that the lack of agreement between different lab- oratories could be due simply to dif- ferent room temperatures, which would cause different results for TABLE 9--CONCENTRATION OF PLACENTA EXTRACT Dilution Assay Found* Sample solu- 10.03 tion 1:2 9.88 1:5 10.08 1:10 9.93 1:20 10.12 1:50 9.72 1:100 10.01 * Calculated to basis sample solution. TABLE 10--EFFECT OF TEMPERATURE OF NONINCUBATED SAMPLE Temperature, Phosphatase, K & A øC. Units/100 mi. 20 91.1 2c •'6.7 30 103 2 35 96.8 TABLE l 1--EFFECT Or ORDER OF ADDITION (NONINCUBATED SAMPLE) Tempera- Procedure I, Procedure I1, ture, K & A per K & A per øC. 100 mi. 100 ml. 20 91.1 202 25 86.7 243 30 103.2 27• 35 96.7 343 the nonincubated sample, an experiment was run to determine the quan- titative effect of this variable. The results are shown in 'Fable 10. It is surprising to note that temperature variations had no significant effect on the nonincubated sample readings, even if the reaction temperature was as high as 35øC. The explanation for this unexpected result was found in the order of addi- tion of the reagents. It turned out that the Folin-Ciocalteu reagent inhibits the phosphate ester hydrolysis, so that the color developed is independent
Purchased for the exclusive use of nofirst nolast (unknown)
From: SCC Media Library & Resource Center (library.scconline.org)