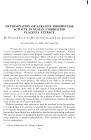
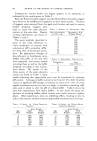
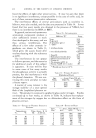
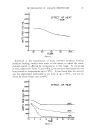
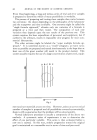
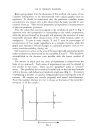
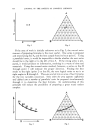
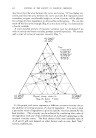
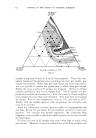
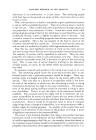
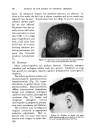
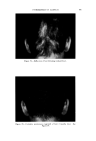
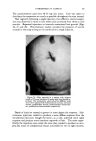
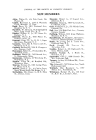
USE OF TERNARY DIAGRAMS 60% $o•p- 0il 0% Alcohol /•OYo Woter 471 loud 3 , Cle Clcer L quicl I0% Soap-Oil Clarity a•' /t.5øC •o% Soap-oH .50% Alcohol 0% Alcohol •0% WaTer •0% Water Fig. 10B The variables forming the basis of our ternary diagram were water, al- cohol and a predetermined mixture of soap and oils having desirable cos- metic properties. On the diagram, the sum of these variables always totals 1• per cent. Since the amounts of antiseptics, color, perfume, etc., are usually predetermined, they were kept constant in all formulations tried. This constant quantity should be added to the sum of the variables above in order to calculate a final 100 per cent formula. The diagram itself was prepared as shown in Fig 9. A series of eight samples along a line from point "A" to the vertex representing 100 per cent water was prepared, resulting in a reasonably good sample at point •7. Samples on either side of this point were more cloudy, and changed to c/ear liquids as they approach point "A." This suggested that a cloudy band would appear on the chart between the desired clear gel and the clear liquid area. Using the principle of crossed series, nine samples were prepared along a line through •7 to the "Soap-Oil" vertex. Three possible products were found at B2, Ba and B4. One of them was brilliantly clear and seemed quite suitable on initial inspection. However, more samples were necessary for general stability evaluation. Using the principle of paralleled series, four

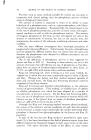
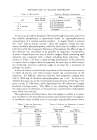
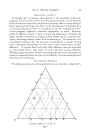
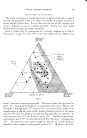
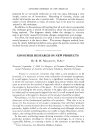
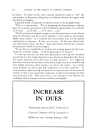
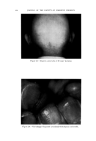
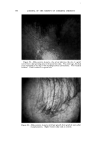
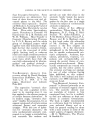
472 JOURNAL OF THE SOCIETY OF COSMETIC CHEMISTS 0% AlconO• IOcp• P•00 cps 150½ps -- I00 cps I)Y, -,Soap-O,I 90 % Wgter •OY•-AIcohel OVa Alcohol Fig. 11 samples along each of lines D, E and F were prepared. These lines com- pletely bracketed the general area containing the clear gel samples pre- viously encountered. Other clear gels were found, but most important, it was now possible to outline the genera/area in which these gels existed. Within this area, a series of 15 samples was prepared. All but six of these could be classified as clear or only slightly hazy. The 43 samples now pre- pared were ready for final evaluation. First, the viscosity of each sample at room temperature was taken and tabulated. Next they were all evaluated for clarity first at room temperature, next at 5øC. and then at 45øC. Finally, with the samples again at room temperature the viscosities were once more recorded. From this information, a ternary pattern similar to a topographical map (see Figs. 10 and 11) was drawn for the condition of clarity at each tem- perature. The viscosity was plotted separately. By comparing these diagrams, it was possible to determine which formula was the most suitable for the purpose. To some, the total of 43 samples may seem rather high to reach a final formulation. However, it must be realized that all of these samples were
Purchased for the exclusive use of nofirst nolast (unknown)
From: SCC Media Library & Resource Center (library.scconline.org)