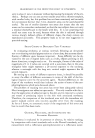
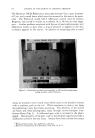
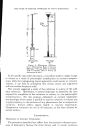
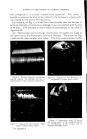
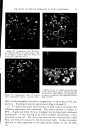
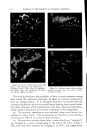
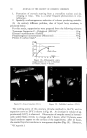
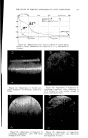
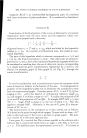
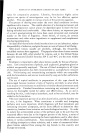
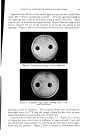
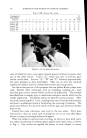
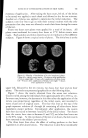
732 JOURNAL OF THE SOCIETY OF COSMETIC CHEMISTS in volume in the same direction, usually increases. In contrast, in the case described here, there can be either an increase or a decrease, and the variations to be measured are very slight. The apparatus (Fig. 4a) is filled as follows: The molten fatty substance is heated to 80øC. It is rapidly poured into a suppository mold and then cooled in the refrigerator. Seven suppositories are then inserted in the flask of the dilatometer and wedged. The dilatometer is next filled with mercury. The latter must be introduced under vacuum, using the setup recommended in Fig. 4b in order to expel air completely. Slight tapping often facilitates this filling. Mercury is introduced only up to the middle of the capillary tube. The filled dilatometer is then placed vertically in a thermostat held at 4-0.1øC (11). After less than half an hour, the temperature is finally stabilized, and the mercury level has risen in the capillary tube and is out- side the thermostatic bath. Graph paper is then attached to the capillary tube with cellophane adhesive tape so that the "zero" point of the scale is opposite the mercury level. Once this operation is completed, the flask can be left vertically or, preferably, tilted in the thermostatic tank to prevent any residual air from leaving the capillary and to collect it in the bend of the flask. It is then sufficient to record the displacement of the mercury level with time. These data can be graphed, using time as abscissa and displacement of the surface of the mercury in mm. (in relation to the zero point) as ordinate. To obtain relative variations of volume, it is only necessary to convert the ordinates expressed in min. by taking into account the diameter of the capillary and the volume of the suppository. To determine volume, a simple technique consists of weighing the mer- cury contained in a portion of the capillary tube. To determine the volume of the suppositories, it is sufficient to weigh a sample prepared with a product of known density, e.g., pure menthol (density -- 0.89). For the apparatus used here, which was equipped with uniform tubes, 103 mm. on the ordinate correspond to a 4% change in volume. Demonstration of Surface zfnomalies For visual examination and photography of surface defects, a lot of sup- positories identical to those inserted in the dilatometer is placed in hermeti- cally sealed powder boxes, at the rate of one per flask. All of the powder boxes and the dilatometer are placed simultaneously into the thermostat at constant temperature, and a powder box is sampled at given intervals for macroscopic and microscopic examin ation.

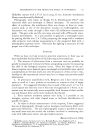
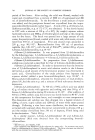
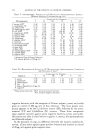
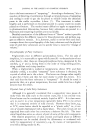
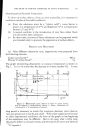
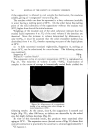
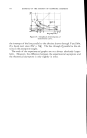
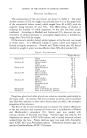
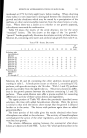
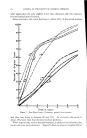
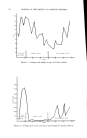
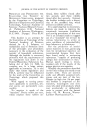
THE STUDY OF SURFACE ANOMALIES OF FATTY SUBSTANCES 733 Determinalion of Favorable Temperalure To show up surface defects, if any, as soon as possible, it is necessary to combine a number of favorable conditions: (a) First, the substance must be a "plastic solid" cocoa butter is plastic at a temperature of 25øC and Suppocire A* at a temperature between 25 and 29øC. (b) A second condition is the introduction of very fine carbon black into the molten fatty substance. (c) In other cases, mixtures of fatty substances can be prepared which are intended solely to promote the appearance of surface defects. RESULTS AND DISCUSSION (a) After different orientation tests, suppositories were prepared from the following mixture: Codex cocoa butter* ...................................... 100 g. Printex U carbon black* ................................... 7 g. The graph representing dilatometry at constant temperature is shown in Fig. 5. It is to be noted that the decrease in volume reaches 4%. A very Figure 5.--Dilatometric curve (beurre de cacao = cocoa butter noir de carbone = carbon black heures = hours diminution du volume en % = % contraction of volume). long period is necessary to attain this maximum decrease, since observa- tions are spread over a month and a half. With other suppository formulas or other experimental conditions, the form of the graph at the beginning of the experiment may be different. But in all cases, after a little time, the process follows a constant course, and the ends of all curves are identical * Cf. Appendix I.
Purchased for the exclusive use of nofirst nolast (unknown)
From: SCC Media Library & Resource Center (library.scconline.org)