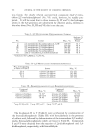
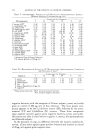
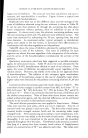
764 JOURNAL OF THE SOCIETY OF COSMETIC CHEMISTS TABLE I--THE EFFECT OF THE EI.IMINATION OF A SCALP MICROBIAL FI,ORA UPON THE WEIGHTS OF SCURF SAMPLES Subject Post- Pre-treatment Treatment treatment Period, Period, Reduction Period, mg. mg. Percentage mg. Percentage Reduction 1 101 49 51.5 31 68.4 2 121 55 55.0 74 38.9 3 82 48 41.2 29 64.5 4 14 19 Increase 20 Increase 5 35 35 None 34 2.9 6 32 29 8.6 15 53.6 7 162 113 30.4 115 29.3 8 69 52 24.1 47 31.9 9 168 152 9.3 115 31.6 TABLE II--AvE•AGE COLONY COUNTS PER MG. or Scu•,r SAMPLE Pre-treatment Treatment Post-treatment Period Period Period Subject (6 Samples) (12 Samples) ( 11 Samples) 1 1,340 93 1,184 2 8,817 11 175 3 1,718 8 83 4 5,188 80 600 5 22,970 113 9,931 6 3,800 175 670 7 14,529 3 48 8 2,275 91 116 9 7,385 38 417 TABLE III--THP, ES•OLD LEVELS OF SCU•,F WEIGHTS Subject Mg. of Scurf Subject Mg. of Scurf 1 27 6 13 2 37 7 70 3 30 8 33 4 18 9 95 5 34 ...... TABLE IV--CoMPARISON OF HEAVIEST PKE-TKEATMENT SAMPLES wI'rH I,IGHTEST TKEATMEN'r AND POST-TREATMENT SAMPLES Subject Heaviest Lightest Lightest Pre-treatment Treatment Post-treatment Sample, mg. Sample, mg. Sample, mg. 1 113 20 15 2 147 32 34 3 115 16 16 4 18 8 4 5 51 18 19 6 43 9 3 7 240 73 20 8 95 23 27 9 216 63 81 Av. 116 29 25

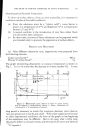
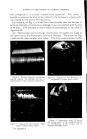
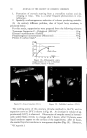
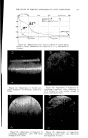
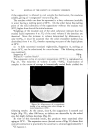
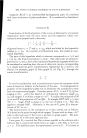
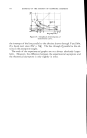
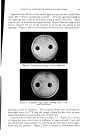
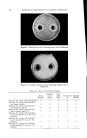
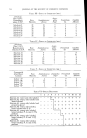
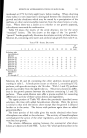
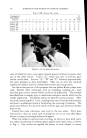
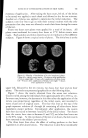
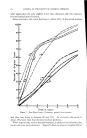
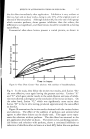
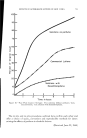
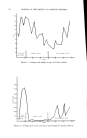
RELATIONSHIP BETWEEN DANDRUFF AND MICROBIAL FLORA OF THE SCALP 765 Changes in the physical appearance of the scurf samples were recorded during each period. As the treatment proceeded, the color of the scurf changed from gray to light yellow. It became less scaly and was powdery and fluffy in texture. Itching of the scalp was a common complaint during the pre- and post-treatment periods, but not during the period of treatment. RESt•L'rS The average scurf sample weights for all subjects are listed in Table I. Also included is the percentage of reduction in scurf weights that resulted from the antimicrobial treatment. There was a significant reduction in scurf weights during the period of treatment that extended into the post-treatment period in seven of the nine subjects. Among the subjects showing significant reduction much individ- ual variation was observed. It was particularly noticeable that scurf weights continued to decline until a scalp microbial flora had been re-estab- lished. Then the scurf weights slowly began to increase toward the pre- treatment levels. When it became apparent that scurf weights had returned to pre-treatment levels, the experiment was terminated. Subjects 4 and 5 did not respond to treatment. Subject 4 obviously had no dandruff problem, as is shown by his very low pre-treatment scurf weight average (14.1 rag.). Subject 5 showed very little variation in scurf weights at any time during the experiment. Except for subjects 4 and 5, the pre-treatment period average weights of all scurf samples was 83.3 rag. This was reduced to 58.6 mg. at the end of the treatment period, a 29.7% reduction, and to 49.8 rag. at the end of the experiment, a 40.3% reduction. Table II shows the bacterial counts for each subject during the three periods. These counts include only those bacteria which grew in Trypticase agar pour plates incubated aerobically at 37øC. They do not represent the total flora but serve to indicate the effectiveness of the neomycin-nystatin treatment. Staphylococcus aureus and Staphylococcus epidermidis were the predominant bacteria that were cultured. The average of the scurf weights of all nine subjects was determined each time a sample was removed. These averages were plotted as shown in Fig. ]. During the period of treatment the average weight of the nine samples was 100 mg. This figure was reduced to 35 mg. during the treatment period. The average values of the plate counts of all nine subjects were similarly plotted and are shown in Fig. 2. At the beginning of the pre-treatment period the values of plate counts as well as scurf weights were low. These low values could be expected because each subject had been instructed to shampoo his scalp one week prior to the removal of scurf samples. A non-
Purchased for the exclusive use of nofirst nolast (unknown)
From: SCC Media Library & Resource Center (library.scconline.org)