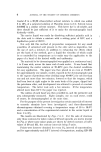
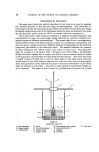
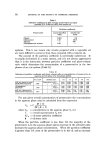
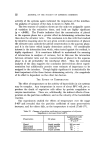
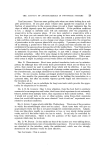
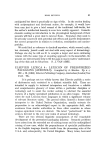
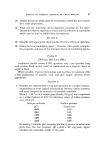
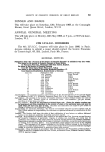
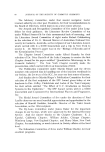
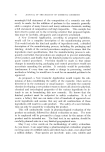
12 JOURNAL OF THE SOCIETY OF COSMETIC CHEMISTS Introduction by the lecturer The main point about the method described is that there is no need to separate the m•terials present in the mixture being chromatoglaphed. The alterations in band shape indicate the particular groups which are present because these give peaks at definite temperatures and in the substances which we have investigated, this peak, say the hydroxyl peak, occurs at 15.8øC no matter what the compound is. At the same time, if the results are plotted in a diagram having temperature and concentration as axes, the peak height being indicated by contours, different sub- stances appear at different concentrations. This means that if. one is investigating mixture about which very little is known, at least as a preliminary examination, one does not have to search around for different methods of separating out the hydroxyl compound, the ketone or the carboxylic acids. The method indicates the presence of these substances and, within reason, how many of them occur. The apparatus (.Fig. 6) consists of a 21 beaker with a Perspex cover which holds a thermometer fitting reasonably tightly into a copper cone which is never removed from the inside of the apparatus, and therefore provides good thermal contact. The cover also holds a length of glass rod bent into a circle at right angles to the stem which holds the actual paper by the tabs (between the sectors), which are bent down at right angles. After the application of the material the paper is held in an atmosphere of petroleum ether for between 1 and 2 min. This time i• quite critical if reproducible results are to be obtained. The paper is then lowered by pushing down the glass rod so that ß I.'•\\\\\\\ ß M Figure 6 Apparatus used (4) A. Thermometer D. Cork H. Chromatographic paper N. Lead shot B. Paper holder E. Two-litre beaker K. Crystallising dish C. Perspex,lid F. Paper lining L. Weight '" G. Copper cone M. Solv•nt

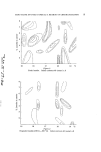
BAND SHAPE ON DYED PAPER AS A METHOD OF CHROMATOGRAPHY the tabs dip into the petroleum ether. Development takes place in less than 5 rain so that there is no difficulty in maintaining the temperature, even with quite a crude type of thermostat, to within 0. IøC. The rod is then pulled up again, the paper removed, and the band pencilled in. The dye used is Dispersol Fast Scarlet B which has a -CH•..CH•.OH side chain attached to the amino group. This group is essential for the production of these large changes in band shape. If the -OH group is phenolic in character the changes are not produced. I have used this dye because it gives the simplest effect with the carrier mixture that I use, i.e. one single peak 85 units high at I?.0øC. Other dyes having a similar structure give multiple peaks. In addition to the work described in the paper we have tried various phenols, all of which give a peak of I&8øC whatever their nature. I am not suggesting that the method would detect such compounds present as antioxidants. I would not claim that it is so sensitive, and I think that the sensitivity, in fact, increases with the surface activity of the compounds present in the mixture. We made a series of fairly complicated molecules and one of the things we found was that if one has compounds with several polar groups, e.g. carboxyl, widely spaced over the molecule the peaks become flattened. The same thing happens When using dyes having surface active groups widely spaced in the molecule. Although, using known compounds, the peak height is only about 85-40 units, irradiateion of oils g{ves quite enormous peaks 80 to 90 'units high. This means, of course, that a band of 1 in 2 area would have an outline 80 to 90 in long. These are quite large changes. One may think that the measurement of the outline and area of the band is not very accurate on such small bands and, of course, this is true, but I do not consider that the accuracy is any less than that involved in estimating the Rs value by orthodox chromatography. In most cases, the effects are so large, that there is no doubt where the actual peak occurs. One can exactly pinpoint the temperature and concentration at which the peak occurs, and one can reproduce it. I think that the ease of reproducing is shown by the fact that students after a few days' practice have no difficulty whatever. DISCUSSION MR. E. W. CLARK : Highly degraded or autoxidised lanolin invariably has greatly increased acid and peroxide values. Yet Figs. 4 and 5 show reduced peaks for peroxides and for acids. Does this indicate that the method is not highly specific for the various group configurations and that it is more dependent on surface activity or some interaction between the sample and the carrier? THE LECTURER The point about surface activity is, I think, to a certain extent true, but the lanolin was degraded at 100øC and I think I am correct in saying that most peroxides decompose below this temperature. You will therefore get the decomposition products of the peroxides rather than the actual peroxides themselves. MR. E. W. C•-ARK : Yes, but when the peroxide is decomposed, additional free fatty acids are formedland one might have expected that the peak due to the carboxyl group would then have been even more marked. THE LECTURER: One of the peaks which is due to carboxyl groups occurs at 18. IøC. In Fig. 4, which is the degraded material, there is one sloping peak which covers the temperature 18.1øC, and two other peaks further up the diagram which are also at 18.1øC. It is true that one can get four peaks with carboxylic acids, but these do not always show for a particular acid one or the other of them may predominate.
Purchased for the exclusive use of nofirst nolast (unknown)
From: SCC Media Library & Resource Center (library.scconline.org)