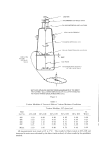
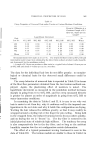
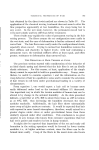
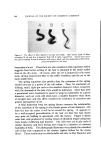
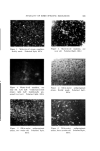
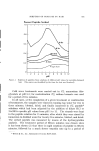
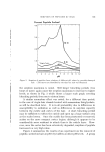
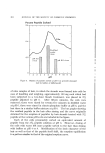
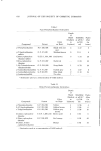
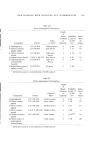
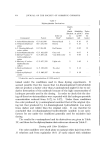
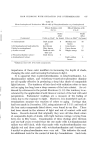
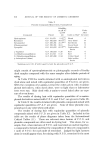
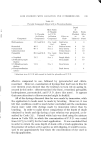
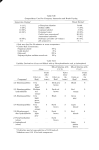
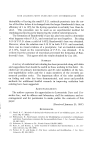
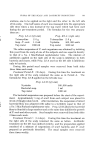
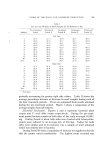
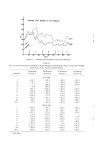
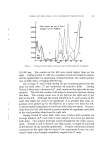
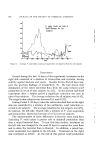
FLORA OF THE SCALP AND DANDRUFF PRODUCTION 633 Table I The Average Weights of Scurf Sainples for All Subjects in Mg Pre-treatment Treatment Treatment Treatment Treatment Subject Pcriod Pcriod A Period B Period C Period D 1 67.9 2 35.0 3 40.8 4 20.2 5 32.0 6 39.1 7 47.2 8 26.0 9 25.3 10 76.3 Ave. 41.0 77 37 37 19 0 49 0 48 8 55.4 30.3 43.5 56.4 45.4 1 71.4 21.6 2 32.4 24.9 3 62.4 30.6 4 19.5 19.7 5 46.8 48.8 6 43.0 31.9 7 51.8 44.6 8 25.8 32.1 9 29.7 33.4 10 71.7 35.9 Ave. 45.4 32.3 Left Side 0 43.9 0 37.7 9 30.1 14.0 62.5 24.7 39.5 28.O 21.1 39.8 34.1 Right Side 11 8 19 9 14 0 12 1 47 8 13 5 37 7 26 0 15.2 20.8 21.9 28.1 39.0 25.7 25.9 19.2 13.9 14.5 . . .o 47.5 6O. 5 19.5 18.8 43.0 32.6 27.3 23.3 12.1 11.1 41.2 31.1 27.8 29.8 10.6 8.2 14.9 17.3 14.5 15.4 14.3 ...o 34.9 44.3 15.1 9.8 34.1 25.7 25.4 22.6 11.9 14.1 24.9 16.7 20.6 20.3 Not done. probably accounting for greater right side values. Table II shows the average percentage increase or decrease in scurf weights during each of the four treatment periods. These are computed from results obtained during the pre-treatment period. Figure 1 shows a comparison of the average weights from all subjects. Microbial Evaluation. Figures 2 and 3 represent bacterial plate counts and P. ovale slide counts respectively. During the pre-treat- merit period bacteria counts on both sides of the scalp averaged 50,000/ mg. During Period A when both sides were treated with tetracycline, counts were reduced to an average low of 200/mg. Values for both sides were similar and in no instance was a sample of scurf obtained which was entirely free of bacteria. During Period B when a suspension of bacteria was applied to the left side the counts varied considerably. The highest count recorded was

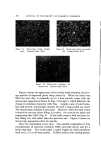
70[ Average Scurf Weights of Ten Subjects 'ø I 50 i.-- //• 40L ,"/•//• i ',,"'' /'-., • /// '\•,' ',/ ",, ,,, I I/ \1 \ • I \\L•ft •o• • \^ ,, ,,,/,,,.., ,,, I .,' V x., •"' '•/ /x, ,o[ ,I I, I. 0 I0 ZO 30 0 50 60 70 80 Days Figure 1. Average scurf weights in mg of aU subjects The Average Percentage Variation in Scurf Weights During Each of the Treatment Periods from those of the Pre-Treatment Period Treatment Treatment Treatment Treatment Subject Period A Period B Period C Period D Left Side 1 +13.4 -23.5 -58.5 2 +5.7 +7.7 -26.6 3 -7.1 -26.2 -52.9 4 -5.9 -30.6 -28.2 5 +53.1 +95.3 +48.2 6 +24.8 --36.8 --50.0 7 +17.3 --16.3 --8.9 8 +16.5 +7.6 +5.0 9 +41.9 --34.1 --62.2 10 -- 26.0 -- 47.8 -- 46.0 Ave. +9.1 --16.8 --33.2 Right Side 1 --69.7 -84.4 -85.2 2 --23.3 --38.7 -54.1 3 -51.1 -77.6 -76.9 4 +1.0 --37.9 -26.7 5 +4.2 +2.1 -25.4 6 --25.8 -68.6 -64.8 7 --13.8 -27.2 -34.1 8 +24.4 +0.8 -1.6 9 +11.1 -35.8 -70.0 10 -49.9 -70.9 -65.2 Ave. -- 30.0 - 52.6 - 55.4 -42.5 -26.0 -60.6 ß ß .a +89.0 --51.9 --30.9 --10.4 --65.3 -58.5 -28.4 --89.3 -46.7 --75.4 ß . .a --53 -77 2 -50 4 -12 4 --61 8 --76 7 --56 4 Not done.
Purchased for the exclusive use of nofirst nolast (unknown)
From: SCC Media Library & Resource Center (library.scconline.org)