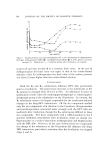
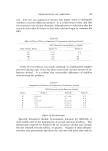
DEGRADATION OF AEROSOLS 189 test. The test was repeated at shorter and longer times to determine whether or not the difference persists. It is evident that it does, and that the reaction is one of some duration, although there is indication that the reaction slows after 48 hours or that side reactions begin to consume the HC1. Table III Effect of Time of Test on Commercial Undenatured Anhydrous Alcohol HC1 Liberated, mg/kg Based on Alcohol Time of Test, Hours Source X Source Y 16 0.3 1.2 24 0.8 1.7 48 4.6 26 72 8.4 28 Table IV lists 24-hour test results obtained on undenatured samples procured during each of the last three years from various sources of an- hydrous alcohol. It is evident that measurable differences of stability exist between the products. Table IV Comparison of Commercial Undenatured Anhydrous Alcohols HC1 Liberated, mg/kg Based on Alcohol Source Series A Series B Series C U 0.0, 0 V 0.1 W 0.1,0 X 0.9 Y 1.4 Z 1.7, 1 1 0.7, 0.8 0 4 + 3 4 0.5, 0.5 1 0.3, 0.7 2 1.4, 1.5 1 2, 1.6,1.2,1.2 1.4,1.8 1 Effect of Den,aturants Specially denatured alcohol, Govermnent Formula 40 (SDA-40), is most widely used in the formulation of aerosol personal products. The denaturants required by Formula 40 are tert-butyl alcohol and include brucine alkaloid, brucine sulfate, o,r quassin. Samples of these denatur- ants that met govermnent specifications, and also had good odor and no

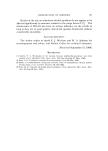
190 JOURNAL OF THE SOCIETY OF COSMETIC CHEMISTS discoloration, were formulated with stable anhydrous alcohol and sub- mitted to the test. In no instance did the test show significantly more in- stability than the original undenatured alcohol. It had been noted, however, that several rejected lots of quassin had tan or brownish colora- tion, and it seemed advisable to check their effect on stability as well as on discoloration of the alcohol. Table V shows that color imparted to alcohol by discolored quassin is not always obvious at a concentration of 0.0113 g per 100 ml, which is equivalent to the government requirement of 1.5 oz per 100 gallons of alcohol. If the color is measured at tenfold the required concentration, the degree of discoloration of alcohol by various lots of quassin becomes more easily apparent. Further data in the table indicate that SDA-40 formulated with discolored quassin shows considerable instability in the test. It is evident that the color quality of the quassin used to formulate SDA-40 is critical on more than one count. Table V Test Results on SDA-40 Formulated with White and Discolored Quassin Lot No. Quassin Denaturant Color in Alcohol Soln., Incremental ASTM Pt-Co Scale HC1 Liberated, Color of mg/kg Based powder visual 0.0113- 0.113- on Alcohol A White 10 20 0.0 B White 10 20 0.3 C Tan 10 30 3.0 D Tan 10 30 12 E Tan 15 60 3.3 "Gratn per 100 tnl alcohol. CONCLUSIONS The measurably greater instability indicated by the test on some com- mercial alcohol samples may derive from presence of minute traces of peroxide impurity. At least, typical peroxide, as known free-radical forming substances, when added to alco.hol induces instability in the test in direct proportion to its concentration. Greater instability in the test forecasted increased metallic contamination of the contents and, there- [ore, corrosion of aerosol cans in a typical accelerated storage test on the unformulated alcohol.
Purchased for the exclusive use of nofirst nolast (unknown)
From: SCC Media Library & Resource Center (library.scconline.org)