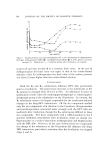
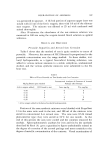
DEGRADATION OF AEROSOLS 187 was permitted to separate. A 12.5-ml portion of aqueous upper layer was mixed with 2.5 ml of the ferric reagent, then with 1.0 ml of the thiocya- nate reagent. The mixture was diluted to 25 ml with methanol and mixed thoroughly. After 10 minutes, the absorbance of the test mixture solution was measured at 460 nm using the reagent-treated blank solution as optical reference. RESULTS AND DISCUSSION Peroxide Impurities and Aerosol Can Corrosion Table I shows that the method of test is quite sensitive to traces of peroxide. Moreover, the amount of HC1 liberated is proportional to the peroxide concentration over the range studied. In these studies, tert- butyl hydroperoxide, as a typical free-radical forming substance, was added in various minute amounts to a stable, anhydrous, unclenatured alcohol, and the various synthetic mixtures were submitted to the 24- hour test. Table I Effect of Trace Peroxide on Test Results and Can Corrosion Mg/kg Based upon Alcohol Active oxygen added a HC1 found in test Incremental Analyses of Contents of Aerosol Package after Storage Iron, mg/kg Tin, mg/kg 0.00 0 0 0 0.05 2 3 0 0.10 4 ...... 0.20 8 4 2 0.50 ... 6 14 Active oxygen added in the form of tert-butyl hydroperoxide. Portions of the same synthetic mixtures were blended with Propellant 11 in the same ratio used in the test, and 100 ml of the mixture were stored in conventional 8-oz aerosol cans. The cans were 0.5-lb tinned plain-interior type they were stored at 54øC for one month. At the end of this period, the cans were cooled and the contents removed for analysis. Spectrophotometric analyses for iron and tin by the methods described by Root (4) gave a quantitative figure undoubtedly related to the degree o.f corrosion of the aerosol package and most certainly to the degree of metallic contamination of the contents. Visual examination of

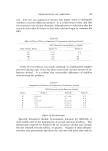
188 JOURNAL OF THE SOCIETY OF COSMETIC CHEMISTS the inner walls of the cans produced little of a quantitative nature, but did indicate that corrosion occurred largely at almost microscopic pin- holes, possibly imperfections in the tin coating. The data in Table I leave little doubt that tin and iron contamination of the contents of the aerosol cans, during a typical accelerated storage test, is likely to increase with increasing liberation of HC1 in the 24-hour test conducted in glass. Effect of Water Content of Alcohol Table II presents data on a pure undenatured alcohol, originally containing less than 0.02% moisture, to which various amounts of water were added prior to test. Water content in the "anhydrous" range (nomi- nally below 0.1%), even up to 0.4%, liberated no more HC1 in the test than the original alcohol. Between 0.8 and 6.2% water the instability of the system increases essentially proportionately. At 7.6% water, corre- sponding to 95 vol % (190-proof) alcohol, the system is quite unstable--a fact well known to the industry. Table II Effect of Moisture on Test Results % on Alcohol Water content by wt Alcohol content by vol Test Results: HC1 Liberated, mg/kg Based on Alcohol O. 02-0.4 100-99.8 0.8 99.5 1.6 99.0 3.2 98.0 4.7 97.0 6.2 96.0 7.6 95.0 04 07 12 20 34 42 70 + The important feature of the above observations from the standpoint of present considerations is that anhydrous alcohol products of commerce can be tested and compared without unnecessary concern for the exact moisture content in the specified range. Application of Test to Commercial Alcohol Samples Table III gives test data on anhydrous samples from two sources. These samples showed significant difference in the results of the 24-hour
Purchased for the exclusive use of nofirst nolast (unknown)
From: SCC Media Library & Resource Center (library.scconline.org)