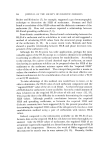
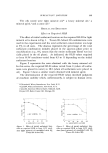
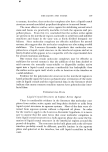
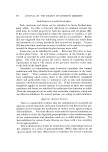
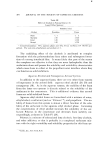
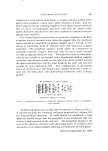
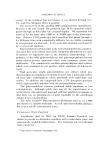
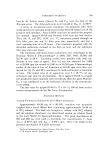
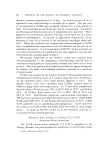
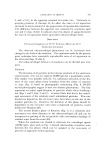
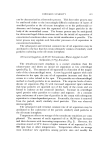
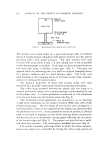
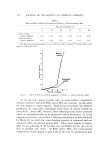
EMULSION STABILITY 405 • 21 2.0 1.9 1.7 1.5 1.0 0.9 .,. \ e•e• e• e•e• 500 1,000 1,500 :•,000 2,500 •,000 •,500 Time in Seconds Figure 3. Example of flotation of oil particles from the bottom of 50% toluene-watcr emul- sion prepared with 7% G-2151 surfactant. The logarithm of the distance of the emulsion- water boundary from the center of the rotor is plotted against the time in seconds of ultra- ccntrifugation at 24,630 rpm in the analytical ultracentrifuge. Figure 3 is a typical plot of the loga- rithm of the distance of the emulsion-water boundary from the center of the rotor, i.e., log x vs. time in accordance with the expected Svedberg relation (1): log x = kt + log Xo = S(rpm)2t + log Xo (1) where xo is the distance of the lower boundary of the cell from the center of the rotor (i.e., the position of the particle at time t: 0) and S is defined as the sedimentation (or flotation) constant. It follows that the flotation rates k = S(rpm) 2 (2) and a plot of the h values or slopes of plots in accordance with Eq. 1 rs. various (rpm)2should be linear, of slope S, and pass through the origin. The high surfactant concentration (7%) emulsions showed no separa- tion of clear toluene under centrifugation forces of 258,000 g's for a period of three days. Microscopic investigation of the opaque portion of the emulsion demonstrated toluene oil particles entrapped in pre- cipitated surfactant. It should be noted that the flotation of low sur- factant concentration (1%) emulsions prepared by the spray techniques was too rapid for study by this technique.

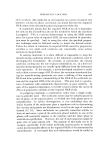
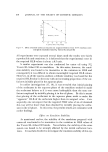
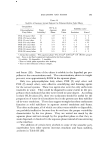
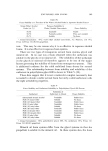
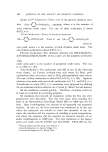
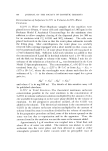
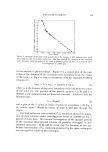
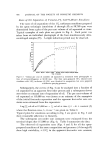
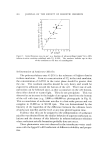
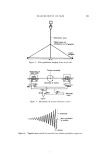
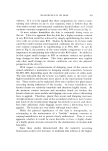
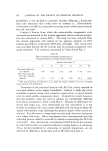
406 JOURNAL OF THE SOCIETY OF COSMETIC CHEMISTS Rates of Oil Separation of Toluene-l% G-2151-Water Emulsions The rates ot• oil separation ot• the 1% surt•actant emulsions prepared by the spray technique (emulsions A through H) at 50,740 rpm were determined from a plot of the per cent volume of oil separated rs. time. Typical examples ot• such plots are given in Fig. 4. Each point was taken from an individual photograph ot• the four simultaneously ultra- centrifuged samples (25). A slight induction period may be observed. 6O 55 5O 45 .= 40 •o :55 15 5 Odd• 19,200 36,400 57,600 76,800 192,000 211,200 230,400 249,600 268,6½ Time In Seconds Figure 4. Volume per cent of available oil separated as monitored from photographs vs. time of ultracentrifugation at 50,740 rpm. The four spray-prepared 50% toluene-water emulsions with 1.0% surfactant (G-2151) were identical in composition but were prepared at different spraying pressures Subsequently, the curves ot• Fig. 4 can be analyzed into a fraction of oil separated by an apparent first-order process and a subsequent slower zero-order or constant rate of separation ot• oil. The per cent volume ot• oil separated at 115,000 sec was chosen as an estimate ot• the asymptote of the initial first-order separation and the apparent first-order rate con- stants were estimated from the expression: Log [% vol oil at 115,000 sec -- % vol oil at time t] = --kt + constant (3) where the flotation rates, k, in sec -• are given in Table I. Typical plots for emulsions according to Eq. 3 are given in Fig. 5 and show reasonable adherence to linearity. The subsequent zero-order rate constants were estimated from the terminal slopes after 115,000 sec (Fig. 4). Table I summarizes the data. The observed oil separation rates (Figs. 4 and 5) for all the spray- prepared emulsions of the same composition and pressures (A through D) show high variability, ___ 1.5% in the apparent first-order rate constant,
Purchased for the exclusive use of nofirst nolast (unknown)
From: SCC Media Library & Resource Center (library.scconline.org)