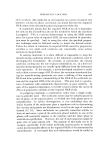
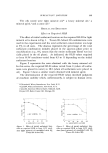
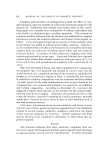
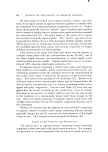
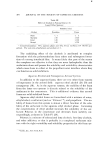
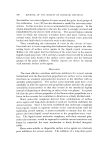
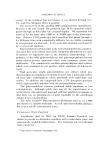
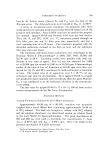
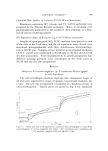
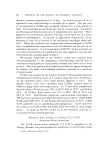
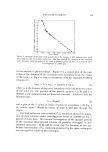
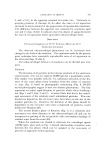
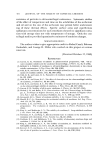
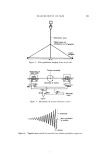
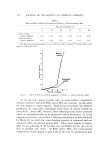
EMULSION STABILITY 407 Table I Apparent Rate Constants for Oil Separation of Toluene-Water-1 c•0 G-2151 Surfactant Emulsions by Ultracentrifugation at 50,740 rpm One Day After Preparation Eleven Days After Preparation Emulsion'* 10Sk(sec-1) b 105ko(%/scc)c 105k(scc-•)b s ' 10 ko(%/sec • A 2.26 6.9 2.08 4.5 B 2.26 6.4 2.08 4.3 C 2.34 6.1 1.95 4.7 1) 2.34 7.1 1.95 4.7 E 2.46 6.0 ...... F 2.85 5.4 ...... G 2.78 6.3 ...... H 2.63 5.8 ...... a Emulsions A through D were prepared to be identical in every respect. Emulsions E through H were identical except that four different spraying pressures were used. • These apparent first-order rate constants for oil separation were obtained from the slopes of the In [amount of oil separated at 115,000 sec minus amount of oil separated at any prior time, t.] rs. t. c These apparent zero-order rate constants represent the constant rate of oil separation after 115,000 seconds. 60 • 30 •-• • 20 * •o / • 9 I 8 7 g o 19,•oo •8.4oo 57•6oo 76,600 Time, t, In •econd• four different sp•[• p•essu•es. •he fi•s[-o•de• As•mptote •as estimated At ]]5,000 sec

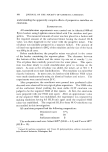
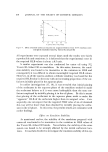
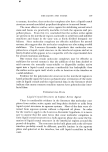
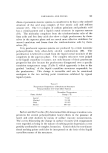
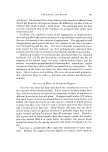
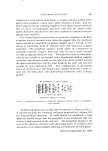
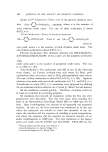
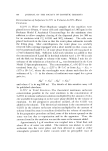
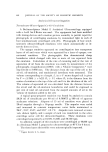
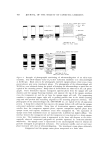
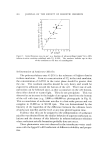
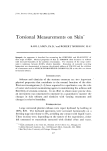
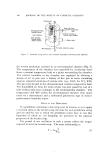
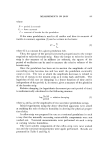
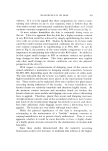
408 .JOURNAL OF THE SOCIETY OF COSMETIC CHEMISTS EMULSION ß -REFERENCE -_4_-- -- - BAR 20 50 I00 250 SEC, SEC. SEC. SEC, TOP OF CELL IToword Rotor Center} _•/Z7••-- CELL WALL / / CLEARED I I •AQUEOUS PHASE COUNTER BOTTOM OF CELL (A•ey From Rotor Center) CELL WALL• ..... AIR -- •'-•N T ER F•'C• OIL -- - •l'• ANSLUCENT CREAM TOP OF CELL (Toward Rotor Center) 3,000 SEC. I0,000 SEC. SEC. • REFERENCE --HOLE IN - -- COUNTER BOTTOM OF CELL [Awoy Fram Rotor Center) '•00,000 SEC, Figure 6. Example of photographic monitoring of ultracentrifugation of an oil-in-water emulsion. The 50-50 toluene-water-l% G-2151 surfactant emulsions were ultracentrifuged at 50,740 rpm. Black areas in the photographs represent opaque phases white areas, trans- parent phases gray areas, translucent phases. The photographs of the ultracentrifugal cell, 20-250 sec, were obtained during the period of bringing the ultracentrifuge to speed but are typical of the creaming process. Sharp lines of demarcation are observed in the cell photo- graphs. These boundaries separate transparent aqueous phase from the opaque cell wall (bottom) and the opaque florating emulsion, and separate the top of the opaque emulsion from the transparent air and the air from the opaque upper cell wall. The compressing emulsion is represented (upper right cell) as grading particle sizes in the initial creaming (top) and with particle sizes remaining ungraded as the creaming progresses (bottom). The photographs of the ultracentrifugal cell, 3,000-600,000 sec, are typical of the oil-separation process. A sharp line is observed that separates the opaque bottom cell wall from the opaque sedimented surfactant micelies. Sharp lines of demarcation separate opaque surfactant micelles horn the transparent aqueous phase, separate transparent aqueous phase from opaque cream, and separate translucent cream from transparent oil. The separation of opaque cream from translucent cream (or separated oil) is definite but slightly diffuse. The interface between the transparent oil and the transparent air was observed as a sharp opaque narrow bar. The translucent cream is represented in the lower cell diagram as the micro- scopically observed compressed polygonal oil particles separated by surfactant-adsorbed mem•oranes. The opaque cream is represented as the microscopically observed toluene oil particles entrappeal in precipitated surfactant. The surfactant micelle, and oil and water phase increased with time of ultracentrifugation. The translucent cream phase ultimately disappeared and the opaque cream phase compressed to a finite value
Purchased for the exclusive use of nofirst nolast (unknown)
From: SCC Media Library & Resource Center (library.scconline.org)