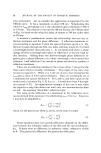
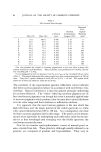
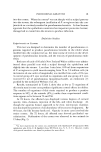
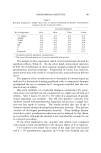
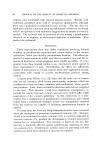
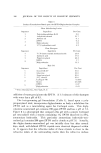
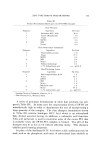
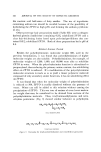
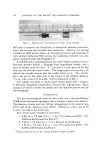
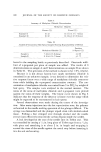
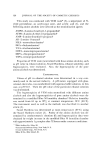
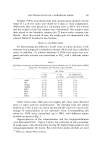
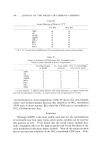
84 JOURNAL OF THE SOCIETY OF COSMETIC CHEMISTS Table I TiO2-Coated Mica Samples Platelets g TiO2/g in Drawdown TiO• (%) Mica (%) mica Lacquer (%)- Estimated TiOa Optical Thickness (nm)• A 0.0 100.0 0.000 2.19 0 B 10.0 90.0 0.111 2.43 36 C 15.6 84.4 0.185 2.59 60 D 20.5 79.5 0.258 2.75 84 E 23.0 77.0 0.299 2.84 96 F 24.8 74.2 0.334 2.91 108 G 27.0 73.0 0.370 3.00 120 I-I 29.0 71.0 0.408 3.08 132 I 30.7 69.3 0.444 3.16 144 $ 32.4 67.6 0.479 3.24 156 K 34.0 66.0 0.515 3.32 168 L 35.6 64.4 0.553 3.40 180 , Per cent platelets (by weight) is inversely proportional to per cent mica to keep mica content constant in each drawdown. Thus, if platelet concentration for G is 3.00%, that for B is 73(3.00%)/90 = 2.43%. v G was designated as 120 nm because it has the same Xm•x as the calculated 120-nm curve of Fig. 3. The optical thicknesses of the other samples were then made proportional to g TiO•/g mica. Thus, for C, optical thickness is 0.185(120 nm)/0.370 = 60 nm. The optical thick- nesses are all based on refractive index for the D line. The similarity of the experimental specular reflectance curves indicates that these nacreous pigments behave in accordance with interference rela- tionships. Optical interference is thus the general principle underlying all nacreous behavior. The "white"-reflecting nacreous pigments are in fact interference pigments even though this term is normally applied only to nacreous pigments which produce color because their optical thickness is in the color range and their thickness is sufficiently uniform. It is apparent that the most lustrous pigment is the one which has high reflectance over the major portion of the visible spectrum, i.e., films with optical thickness from 100 to 140 nm. As a consequence, the most brilliant nacreous pigments fall in this range. The point can be demon- strated more rigorously by multiplying each reflectance value by eye sen- sitivity at that wavelength and averaging over the visible spectrum the conclusion remains the same. Now let us examine spectrophotometric curves ooe natural pearl es- sence crystals from fish. These platelets, although usually referred to as guanine, are composed of guanine and hypoxanthine. They vary in

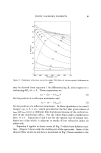
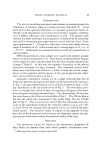
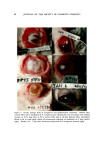
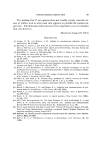
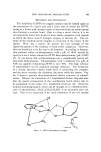
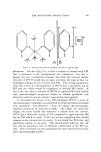
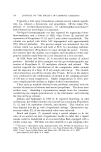
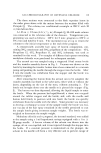
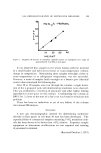
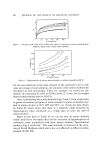
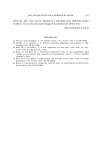
WHITE NACREOUS PIGMENTS 85 4oo 4•o 5oo 5•o Wovelenqth (nm ) Figure 4. Experimental reflectance curves of TiO•-coated mica of various TiO• optical thick- nesses, in nitrocellulose. Reflectance relative to BaSO4 guanine-hypoxanthine ratio (guanine is always the major component) and in shape, depending on the species and tissue. Figure 5 compares spectrophotometric curves of two types of crystals from the herring, Clupea harengus. The top curve is for the "plates" (approximately 30 X 6 X 0.07/•m) obtained from scales, the bottom curve for the very broad crystals (up to approximately 130 X 70 X 0.02 vm) from the swimbladder. The swimbladder crystals are less than one-third as thick as the scale crystals rough estimates of the thickness of swimbladder crystals from the shadow lengths on electron microscope replicas gave values ranging from 15-28 nm, with an average of about 23 nm (6). The concentrations in the drawdown solutions were adjusted in accordance with the thick- nesses to make the reflecting areas the same in both cases, i.e., 2.1% scale crystals versus 0.59% swimbladder crystals. The scale crystals are 76% guanine-24% hypoxanthine, the swimbladder crystals 90% guanine- 10% hypoxanthine. The effective refractive index for light perpen- dicularly incident to the plate is about 1.85 in each case. The curve of the scale crystals has a maximum at about 520 nm. Ac- cordingly, these platelets fall in the range of maximum luster. Optical
Purchased for the exclusive use of nofirst nolast (unknown)
From: SCC Media Library & Resource Center (library.scconline.org)