340 JOURNAL OF THE SOCIETY OF COSMETIC CHEMISTS

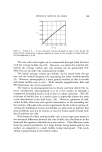
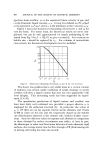
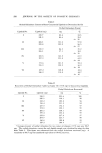
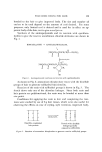
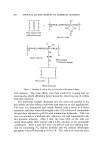
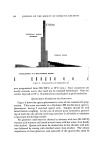
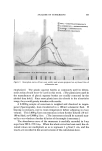
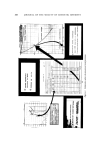
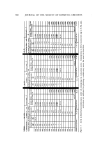
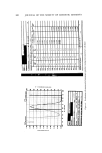
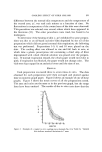
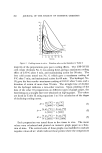
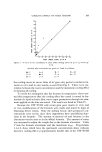
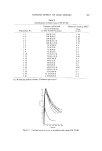
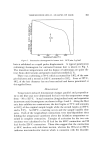
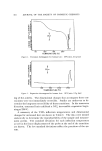
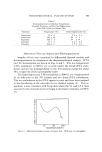
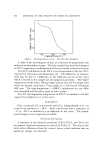
ANALYSIS OF SUNSCREENS 341 After the absorption curve is run, the intersecting points at every 5-mv band are read and recorded as usual (Fig. 5). These readings can be con- sidered the result of scanning 0.5 g of 1% solution per liter, or to repre- sent 1.000 g of 0.5% solution per liter. Next follows the usual conversion to per cent transmittance, and multiplication by the "Incident Erythemal Factor." The sum of these values is divided by "Total Sum of Incident Erythemal Energy" and the result is plotted as the "0.5% intersecting point" where concentration is plotted against transmittance. Semilogarithmic (3 cycles x 10 to the inch) chart paper was found sat- isfactory for this purpose, 1 in. taken as 0.5% of screen concentration. The next step in the plotting of the "Standard" or "evaluation curve" stems from the same original spectrogram, but is calculated as if 1 g/liter of 1% solution is to be interpreted. To accomplish this, the original ab- sorbance data are simply each multiplied by 2 to obtain a new set of values, and represent absorbance of 1 g/liter/1 cm. These absorbance values are subjected to the same procedure as was done with the 0.5% value, but plotted as 1% intersecting point. In the following steps it is necessary to return again to the original spectrogram (or better still, the data can be read directly from the "0.5% data sheet) (Fig. 5, top left) and to multiply the absorbance data in its first column by the appropriate correction factor. (By postulating that we deal with 1, 2, 3%, etc., solutions, we must also divide the weight of sunscreen concentration actually used in this work by 1, 2, or 3 and so on. These "correction factors" are used so that each case can be ex- pressed as containing the standard 1 g/liter/1 cm in the end). It must be obvious by now that all subsequent calculations are based on one original spectrogram this explains the need for cleanliness, and weighing and other analytical accuracy. Any small error due to poor reading of the intersecting points of the spectrogram will cause errors. Curves plotted by different operators using this procedure are in good agreement at low absorber concentrations. When higher percentages of absorber are calculated, operator errors are greatly magnified. For the average suntan lotion containing from 1-2% absorber, how.ever, the error is virtually nil. Having plotted the standard "evaluation curve" according to the method above, one is able to evaluate any commercial sunscreen prepara- tion containing that particular absorber. When it is necessary to evaluate a commercial sunscreen preparation containing an unknown absorber and the standard curve for that particular uv absorber is not available, a "known" evaluation curve can be used, but it must express findings as
Purchased for the exclusive use of nofirst nolast (unknown)
From: SCC Media Library & Resource Center (library.scconline.org)