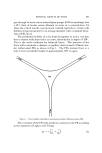
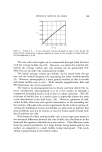
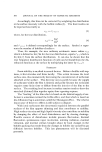
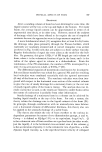
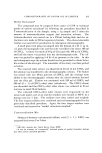
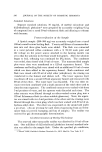
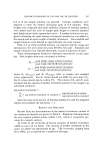
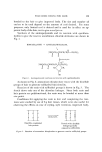
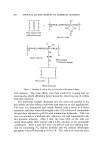
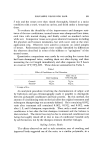
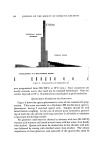
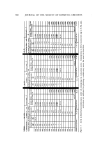
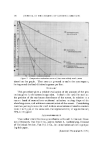
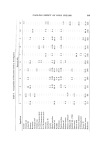
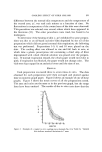
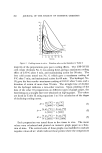
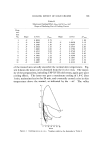
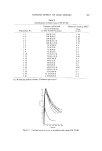
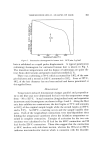
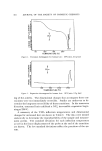
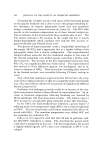
COOLING EFFECT OF COLD CREAMS 351 difference between the normal skin temperature and the temperature of the treated area, /xt', was read each minute as a function of time. No fluctuations in temperature of the control area of the skin were observed. This procedure was selected over several others which have appeared in the literature (15). The other procedures were tried, but found to be inadequate. To determine if the heating of skin (--/xt') exhibited by some prepara- tions was due to an oil-based occlusive film depositted by the oil of the preparation which did not permit normal skin respiration, the following test was performed. Preparations 1-5, 8, and 10 were placed on the skin. The cooling effect was allowed to rise and fall back to zero, at which time a plastic prescription vial containing a dried strip of filter impregnated with cobalt chloride solution was placed over the prepara- tion. If normal respiration ensued, the cobalt paper would turn blue to pink if respiration was blocked, the paper would not change color. The vials were kept capped in an analytical oven until the time of use. RESULTS Each preparation was tested three to seven times in vitro. The data obtained for each preparation were then averaged and plotted against time on numeric graph paper. Figure 2 shows an example of one of these graphs. Figure 3 shows the mean curves of all the preparations tested. The axes and scales are the same as in the previous graph, but the range lines have been omitted. The results of the in vitro tests show that the 20 250 40 50 60 MINUTES Figure 2. Example of a typical in vitro cooling curve (formula No. 6 in Table I). Vertical bars indicate standard deviations in 7 runs

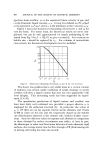
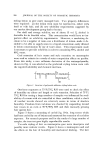
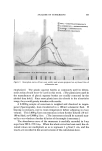
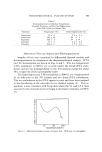
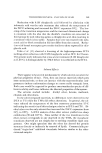
352 JOURNAL OF THE SOCIETY OF COSMETIC CHEMISTS 6 • 10 0 I0 20 30 40 50 60 Minutes Figure 3. Cooling curves in vitro. Numbers refer to the formulas in Table I majority of the preparations gave poor cooling effects. The USP XVIII cold cream (formula No. 1) was among these, giving a maximum cooling effect of 2.75øC after 3 min, and maintaining action for 30 min. The best cold cream tested was No. 6, which gave a maximum cooling of 9øC after 7 rain, and maintained action for 60 min. The hydrogel, No. 10, gave the best results--maximum cooling of 10.5øC after 7 rain, and a duration of action of more than 7'0 min. The straight line of decline for the hydrogel indicates a zero-order reaction. Upon plotting of the data of the other 10 preparations on different types of graph paper, the best fittings to a straight line were obtained on log-log paper. The values are listed in Table II, using equations 1 to 3 for calculation of the slopes of declining cooling curves. ko = [øc] - at.. lOCI t.. [mini -- t• [min] k• -- In At• [øC] -- In At.. [øC] (2) t2 [mini -- t• [mini k.. = In at• [øC] - In at.. [øC] In t.. [min] - In tx [min] (3) Each preparation was tested three to five times in vivo. The mean values were calculated and plotted on numeric graph paper as a func- tion of time. The vertical scale of these graphs was modified to include negative values of At/, which indicate .those points where the temperature
Purchased for the exclusive use of nofirst nolast (unknown)
From: SCC Media Library & Resource Center (library.scconline.org)