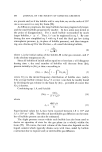
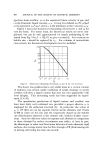
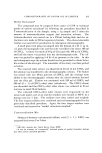
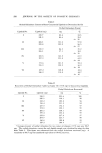
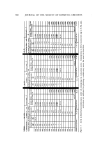
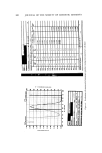
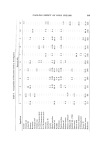
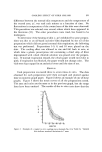
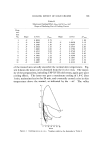
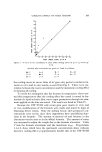
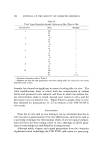
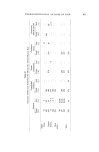
354 JOURNAL OF THE SOCIETY OF COSMETIC CHEMISTS present in the curve may be explained if the USP cold cream is not a true emulsion, but a pseudoemulsion, since none of the true emulsions gave a valley. Further experiments are required to confirm or reject this hypothesis. It is important to note that the USP formula was not the only prepara- tion to cause a rise in skin temperature. Preparations 2-5 and 8 also ex- hibited --at'. Preparation No. 6 showed only slightly better maximum cooling of 2.75øC after 4 min, but maintained action for 60 min. The suspension-emulsion, No. 11, gave a maximum cooling of 2.83øC after 1 min, and maintained a more sustained cooling effect over a 70-min period. The valley present in this curve may also be caused by the fact that the preparation is not a true emulsion. Further experimentation is again required to confirm this hypothesis. The hydrogel, No. 10, again gave the best result--maximum cooling of 6øC after 20 rain, and a 70-rain duration of action. The straight line of decline for the hydrogel again indicates a zero-order reaction. Semilog and log-log plots of the data of the other preparations gave best fitting to a straight line on semilog paper, indicating first-order reactions. The values are listed in Table II. In order to find a possible correlation between the in vitro results with the in vivo data, the cooling curves were drawn on identical graph paper and cut out then the weights of the areas under curves were de- termined in milligrams. The area under the curve of the preparation with the maximum cooling effect (No. 10 in Table I) was considered as 100% and the areas under the curves of the other preparation expressed in per cent. The results are listed in Table III. A plot of area under Table III Cooling Effect of Ointments Expressed in Per Cent of Weight of Areas under the Curves for the Time Interval 0-65 Min Preparation % of Area under Cooling Curve No. in vitro in vivo 1 2 3 4 5 6 7 8 9 lO 11 11.1 10 5 11 3 38 45 51 5 3O 9 91 23.4 100.0 48.2 23 8 2 7 100 46 70 I 7 21 27 27 2 9 0 0 0 8

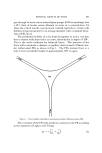
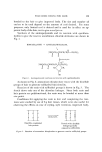
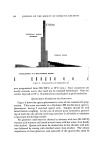
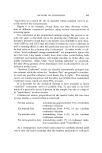
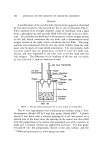
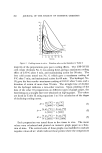
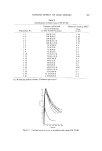
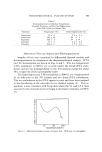
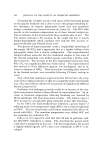
COOLING EFFECT OF COLD CREAMS 355 100 - 8C ß ,-. 60 '40 • •o • IO i i [ I I I I I i i I0 20 50 40 50 60 70 80 90 I 0 0 AREA UNDER CURVE At' IN % Figure 5. In vitro-in vivo correlation of areas under cooling curves of At in % versus At • in % Symbols refer to formula nos. given in Table I as follows: •--1 A--4 V--7 • --10 O•2 •--5 V--8 • --11 ,•--3 C--6 X--9 the cooling curves at versus those of at' gave only partial correlation be- tween in vitro and in vivo results, as seen from Fig. 5. There is no cor- relation between the water concentration and the maximum cooling effect or duration of cooling. To verify the assumption that the increase in temperature above nor- mal skin temperature after the cooling effect has ceased is caused by for- mation of a ]ipid occlusive film, water vapor permeation through the oint- ment applied on the skin was tested. The results are listed in Table IV. Because the USP XVIII cold cream gave poor results in vitro and in vivo, modifications of the formula were made and tested in hope of obtaining better results. Only the sodium borate and spermaceti con- centrations were varied, since these ingredients have emulsifying func- tions in the formula. The amount of mineral oil and beeswax in the alterations was the same as in the official formula. The amount of water was increased to adjust the weight due to the formula alteration. Table V lists the formula alterations and the maximum Atmax. Preparations 1.1-1.5, those which have the spermaceti concentration alone reduced, showed a cooling effect at approximately double that of the USP XVIII
Purchased for the exclusive use of nofirst nolast (unknown)
From: SCC Media Library & Resource Center (library.scconline.org)