262 JOURNAL OF THE SOCIETY OF COSMETIC CHEMISTS can likewise be controlled by additional replication (for example, by averag- ing data obtained on successive days or by the use of additional test sub- iects* ). Aside from the above, the RM consistently yields different point estimates of per cent reduction than those obtained with the SSEM, using the same posttest data. Since the latter can be shown to be correct due to the balance of the experimental design, the question arises as to the source of the disagree- ment. Either both estimates are correct, or the use of the RM introduces a bias into the estimates. Since the confidence intervals obtained by either method (with correct calculations ) generally include both point estimates, this ques- tion cannot be answered with certainty without further investigation. It seems clear, however, that the safe procedure is to use the SSEM, in view of its known validity (in addition to its practical advantage of requiring less time and effort). The above remarks apply to the comparison when statistically correct meth- ods are used in analyzing RM data. However, there appear to be as many methods of data analysis as there are practitioners, and all of those we have examined are incorrect and produce incorrect results. There are three com- mon errors, which are (1) lack of recognition of the nonnormal character of the milligram-weight ratios and per cent reduction values (2) lack of correct randomization prior to and during the clinical work and (3) the use of a de- sign implying a model not reflected by the analysis. The first of these errors can be remedied by an appropriate transformation of the ratios. Since it has been shown that the milligram weights used to form the ratios are log normal- ly distributed (5), it follows that the adiusted ratios are also log normally dis- tributed. Thus the proper transformation of the ratios is logarithmic. The problem of finding an appropriate transformation in order to validate the as- sumptions underlying the ordinary statistical procedures is a very common one and has been treated extensively in the literature of applied statistics (6-•2). The second error can be corrected by the use of the appropriate randomiza- tion procedures and the third by the performance of a suitable analysis. Summary Since the removal of the sides effect from error is a property of the analysis used with the SSEM and since the balance in the design guarantees an un- biased estimate of the per cent reduction, questions inherent in the use of the *If this is attempted, however, care must be taken to do the analysis correctly, as measurements on the same subiects on successive days are likely to be correlated.

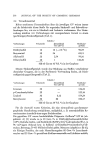
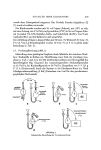
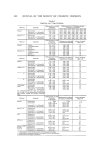
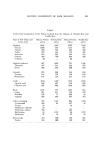
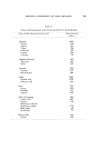
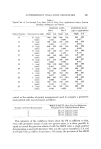
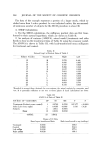
ANTIPERSPIRANT EVALUATION PROCEDURES 263 RM are easily avoided by using the SSEM. We will now present examples to illustrate the calculations for the SSEM in detail and to compare these with RM calculations. Examples General Using data from several sources, we have analyzed 5 sets of two-sample data in three different ways. None of these methods will efficiently detect interactions among sides, treatments, and subiects, although a new design, discussed briefly later on and now being studied in this laboratory, has this capability. The most interesting of these interactions would be those in- volving treatments, of course, but it is not known at present whether they exist and, if so, whether their magnitudes are important. We will illustrate the following procedures in this section. A. SSEM procedure: This is the recommended analysis and gives unbiased estimates of per cent reduction. In this analysis, the effects of sides, subiects, and treatments are removed from the error estimates used to compute confi- dence intervals. The method does not require pretest ratios. B. RM procedure (incorrect numerical analysis): This illustration will use one of the several incorrect procedures commonly employed to obtain per cent reduction estimates and confidence intervals, using adjusted ratios. The procedure is included to illustrate the distortion of results brought about by its vi_olation of the statistical assumptions of normality and homogeneity of vari- ance, as well as its failure to take residual sides effects into account. C. RM procedure (correct analysis): This illustration will show the analy- sis of adiusted ratios when the above assumptions and a possible residual treatments times sides effect are accounted for. Its disagreement with the cor- rect results yielded by the SSEM analysis (see (A) above) will be shown. We shall describe the computations for each of the above procedures in some detail, using a single small set of data to allow the reader to compare the arithmetic involved in each case. We shall then summarize the results we ob- tained in applying the same procedures to each of the four other sets of simi- lar two-sample data. Table ! gives a set of milligram data from 12 subiects, using the design of Fig. 1, with both pretest and posttest weights, for an antiperspirant known to be effective. For simplicity, we present data from only i pad and i hot-room collection posttest, the latter done after 4 antiperspirant applications. Note that, as was explained earlier, SSEM tests done for this laboratory normally use only i day of hot-room testing, done after 5 daily antiperspirant applica- tions, and our test is completed in 5 days.
Purchased for the exclusive use of nofirst nolast (unknown)
From: SCC Media Library & Resource Center (library.scconline.org)