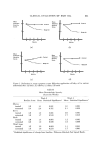
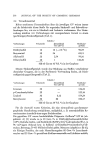
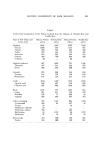
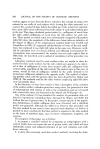
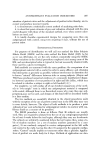
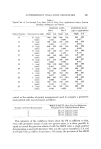
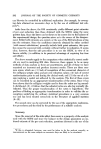
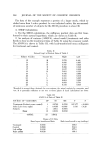
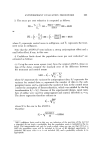
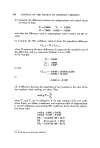
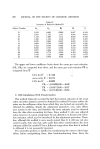
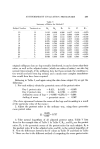
270 JOURNAL OF THE SOCIETY OF COSMETIC CHEMISTS Table VI ANOVA of R'L Data of Table V (Method C) Source of Variation DF SS MS F Due to side treated i 0.0090 0.0090 0.106 Error 10 0.8470 0.0847 Total 11 0.'8560 Most are very similar, but as can be seen, the difference increases as a function of the disagreement between the two pretest ratios. In experiments in which more than two pretest ratios are used, or with larger sets of subjects, such sub- stantial disagreements will be more numerous. 4. Using the log-transformed adjusted ratios R'L, carry out the ANOVA of Table VI (separating "side treated" and error). This procedure is equivalent to doing a t-test for side treated (the square root of F is t in this case), but is done as a convenient method for obtaining an error estimate free of any sides effect. 5. The standard error of the mean of the logs of the adjusted ratios is ob- tained from the ems in Table VI. Confidence limit are then calculated about the mean value of RL, antilogs taken, and the per cent reduction and its 95% confidence limits obtained. Mean of logs of adjusted ratios = R'L = --0.5097 Standard error of mean = - 0.0840 to.o• at 10 df = 2.228 CLo.,• = R'•n --- S• to.o• = -0.507 _+ (0.0840)(2.228) = -0.3226 to -0.6969 antilog (-0.6969) = 0.498 (lower 95% CL for ratio) antilog (-0.5•7) = 0.601 (mean ratio) antilog (-0.3226) = 0.724 (upper 95% CL for ratio) PR• = (1-0.724)1• = 27.60 (lower 95% CL for PR) PR = (1-0.601)100 = 39.90 (mean per cent reduction) PRa= (1-0.498)100 = 50.20 (upper 95% CL for PR) Sum•ry Methods A, B, and C were applied to 5 sets of •o-sample antiperspirant data involving varying numbers of subjects, following the procedures just il- lustrated. The results are summarized in Table VII.

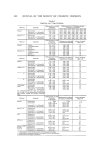
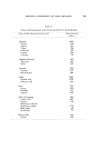
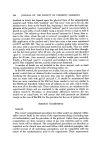
ANTIPERSPIRANT EVALUATION PROCEDURES 9.71 Table VII Comparison of Results of Analysis of Txvo-Sample Data Sets Using Methods A, B, and C Method Data Set Number Statistic A B C (SSEM) (RM) (RM) (used in 1. examples) 3. a Number of subjects 12 12 12 Mean PR 46.01 38.27 39.90 CL9.• about PR 38.4 to 52.7 28.5 to 48.0 9.7.6 to 50.2 Width of CL.•,• 14.3 19.5 22.6 Number of subjects 36 36 36 Mean PR 20.51 15.03 16.61 CLg• about PR 13.6 to 26.• 9.3 to 20.8 11.0 to 21.9 Width of CL.•., 13.2 11.5 10.9 Number of subjects 36 36 36 Mean PR 44.14 39.91 43.10 CL,,• about ?R 36.1 tt• 51.2 33.6 to 46.3 35.7 to 49.6 Width of CL.•.• 15.1 12.7 13.9 Number of subjects 8 8 8 Mean PR 19.61 21.60 24.56 CL• about PR --11.7 to 42.1 1.6 to 41.6 3.7 to 40.9 Width of CL9.• 53.8 40.0 37.2 Number of subjects 12 12 12 Mean PR 14.07 14.19 15.45 CL•.• about PR 1.3 to 25.2 3.2 to 25.2 3.8 to 25.7 Width of CL•,• 23.9 28.4 21.9 •This set showed a moderate sides effect in methods A and C. The sides effects in the other sets, before correction with ratios, appeared to be quite small. MISCELLANEOUS lqELATED TOPICS Sympathetic Effect An hypothesis, which has been advanced occassionally, suggests that an ef- fective antiperspirant applied to one axilla might stimulate additional sweat- ing in the opposite (control) axilla. An argument in favor of the use of the RM, in spite of the disadvantages suggested in the foregoing discussion, might be the assumption that it will correct for this "cork effect" because it uses pretest control values, which are obviously unaffected by the antiperspirant treat- ment. We made calculations from the 5 sets of data summarized in Table VII, using the SSEM method, but with pretreatment instead of concurrent con- trols. Of course, this procedure introduces substantial additional variation,
Purchased for the exclusive use of nofirst nolast (unknown)
From: SCC Media Library & Resource Center (library.scconline.org)