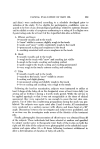
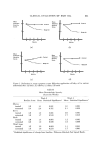
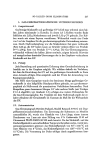
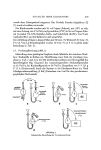
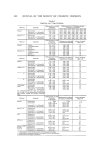
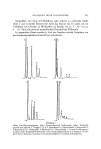
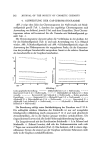
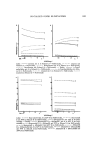
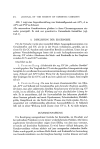
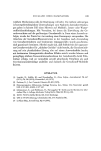
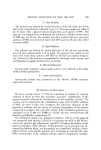
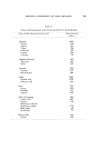
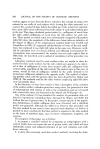
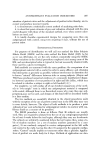
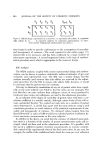
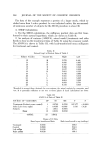
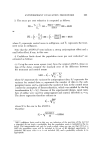
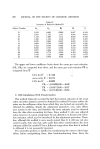
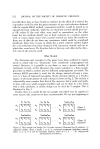
272 JOURNAL OF THE SOCIETY OF COSMETIC CHEMISTS but with these data we have found no evidence for the effect. If it existed, the expectation would be that the point estimates of per cent reduction obtained with the regular SSEM method (concurrent controls) would be biased in an upward direction (inflated), while the use of pretest controls should give low- er PR values. If the cork effect were small or nonexistent, on the other hand, the two methods should vary in their outcomes in a random manner with, of course, larger errors when a priori controls are used. Our results on these sets of data do not show any consistency which could be considered significant there were 4 eases in which the a priori controls yielded higher per cent reductions than those obtained with concurrent controls and one in which they were lower. We therefore believe that any cork effect in the data- if it exists at all-must be small. Other Models The discussion and examples in this paper have been confincd to experi- ments in which only two "treatments" were considered: antiperspirant and control. However, it is possiblc to use three or even a greater number of treatments. In fact, at this laboratory the usual evaluation is a three-sample procedure in which a control and two different antiperspirants are tested. The orclinary SSEM procedure is used, but the design, instead of being a cross- over, is a form of balanced incomplete blocks structure known as a Youden square. A schematic picture of such a design is shown in Fig. 2. The analysis is substantially more complex than that of the crossover, but is easily and quick- ly done with even small computer facilities and can be done in a few hours with a desk calculator. A similar design can be used for 5 samples. This is illustrated in Fig. 3. Finally, there is a model for thc two-sample test which may be superior in some ways to the crossover we have recommended. We are just beginning to A 1 A2 S• Sa S• S• S• S• S•S•7S•e T 1 T2 T 3 T 2 T 3 T1 A 1 A 2 T 1 T2 T3 T2 T 3 T 1 A 1 A 2 T1 T 2 T 3 T 2 T 3 T 1 (Type I Squares) $19520S21 $22S2352• S3•S35S36 A 1 A2 T2 T3 T1 A1 I T2 T3 T1 T1 T2 T3 A2 I T1 T2 T3 A 1 A 2 T2 T 3 T 1 T1 T 2 T 3 (Type II Squares ) Figure 2. Three-sample test design (9, x 3 Youden squares) (illustrated for 36 subjects): Ai represents axillae, where i equals 1 or 2 Tj represents treatments (including control), where j----1, 2, or 3 and Sk represents subjects, where k = 1, 2 . . . 36. (Appropriate randomization not shown.)

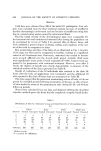
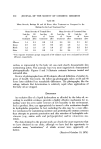
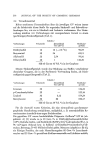
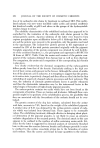
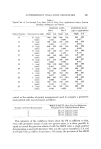
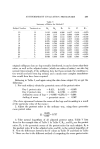
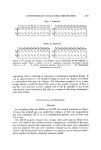
ANTIPERSPIRANT EVALUATION PROCEDURES 273 (Type I Squares) S1S2 Sa St S5 S6 S? Ss So AllT1 T2 T 3 T 4 T 5 T 1 T 2 T 3 T 4 T5 A 2 T2 T 5 T4 T 1 T 3 T 3 T 4 T 2 T 5 T 1 S11S12S13S1•S15S16S17S18S19S2o AllT1 T2 T 3 T4 T 5 T 1 T 2 T 3 T 4 T 5 A 2 T 2 T 5 T4-T 1 T 3 T 3 T 4 T2'T 5 T 1 (Type II Squares) S21S22S2aS2•S25S26S2?SasS29Smo SmlSm2SmaSm•SmsSm6Sm?SasSm9S•o AiIT2 T5 T 4 T 1 T 3 T 3 T 4 •72 T 5 T 1 A 11 T2 T5 T 4 T 1 T 3 X 3 T 4 T 2 T 5 T 1 A21T1 T2 T 3 T 4 T 5 T 1 T 2 T 3 T 4 T 5 A 2 T 1 T 2 T 3 T 4 T 5 T 1 T 2 T 3 T 4 T 5 Figure 8. Five-sample test design (2 x 10 Youden squares) (illustrated for 40 Subjects). A, represents axillae, where i equals 1 or 2 Ti represents treatments (including control), where j= 1, 2, . . . 5 and S• represents subjects, where k = 1, 2 . . . 40. (Appropriate randomization not shown.) experiment with it, although it represents a well-known statistical design. It can be characterized as a 2 2factorial design in which one degree of freedom is confounded with pairs of subjects. The laboratory protocol (it is a two- sample design) would be almost the same as the regular crossover of Fig. 1, but the error structure is more explicit and it will be possible to use it not only for the usual evaluations but also as a means of detecting treatments x sides interactions. CONCLUSIONS AND DISCUSSION General In evaluating either the SSEM or the RM, the central questions are these: (1) does the method give an undistorted estimate of the true (population) per cent reduction (2) if so, is it satisfactorily precise and (3) how easy is it to use? The SSEM analysis removes the average sides and subjects effects from error. The width of the confidence limits it produces is a function of the num- ber of subjects used in the experiment, as well as the basic error associated with the protocol. The per cent reduction estimate can be shown to be un- biased, and the precision of the estimate is as good as can be obtained with a given number of subjects, using the crossover model.
Purchased for the exclusive use of nofirst nolast (unknown)
From: SCC Media Library & Resource Center (library.scconline.org)