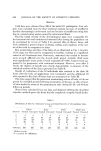
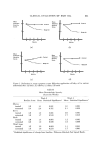
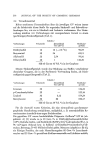
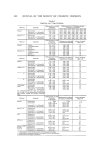
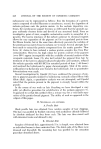
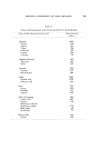
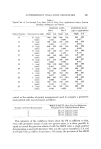
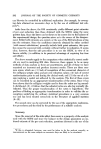
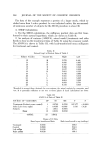
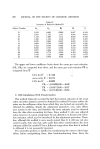
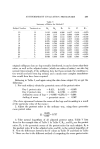
264 JOURNAL OF THE SOCIETY OF COSMETIC CHEMISTS The data of the example represent a portion of a larger study, which in- cluded more than i active product. As was indicated earlier, the recommend- ed minimum number of subjects for the SSEM procedure is about 36. A. SSEM Calculations 1. For the SSEM calculations, the milligram posttest data are first trans- formed to their natural logarithms, which are shown in Table II. 2. An analysis of variance (ANOVA), mixed model (treatments and sides fixed), is done on the transformed data of Table II, using the crossover model. The ANOVA is shown in Table III, with back-transformed mean milligrams for treatment and control. Table II Natural Logs t of Posttest Data of Table I Subject Number Treated On Right Left 13 R 5.572 6.446 14 R 6.098 6.507 15 R 5.717 5.940 16 R 5.380 6.040 17 R 5.817 6.209 18 R 5.663 6.323 19 L 6.745 5.900 20 L 5.991 5.549 21 L 6.131 5.565 22 L 6.064 5.298 23 L 6.669 5.784 24 L 6.319 5.645 •*Rounded to nearest three decimals for convenience the actual analysis by computer used ten. It is generally sufficient to use t•vo or three places if hand calculations are done. Table III ANOVA of Data of Table II SOURCE OF VARIATION DF SS MS F P Treatments(Product versus controD 1 2.2795 2.2795 107.477 0.0001 Sides(Left versus right) i 0.0385 0.0385 1.816 0.20 Su•ects 11 1.0611 0.0965 E•or 10 0.2121 0.0212 TOTAL 23 3.5912 Means of 12 Data Based upon transformed data Back-transformed to mg (antilogs) Treatment 5.6656 288.8 Control 6.2820 534.9 Left axillae 5.9338 377.6 Right axfilae 6.0139 409.1

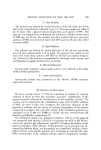
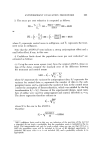
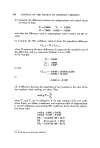
ANTIPERSPIRANT EVALUATION PROCEDURES 265 3. The mean per cent reduction is computed as follows: or PR -- T2 - T• 100 = 534.9 -- 288.8 100 = 46.01 52534.9 pR=(1 •1) (1 288'8•100=46.01 - •2 100= 534.9 where T2represents control mean in milligrams, and T• represents the treat- ment mean in milligrams. Note that the ANOVA F tests indicate a strong antiperspirant effect and a small sides effect, if any, in this ease. 4. Confidence limits about the population mean per cent reduction* are estimated as follows: (a) Using the error mean squa.re (emr) from the original ANOVA (done on logs of the data), compute the standard error of the difference between the treatment and control means SED =S7 • S•2 S2• nl n• where S12 represents the variance for antiperspirant data S22 represents the variance for control data nl represents the number of data in the anti- perspirant mean and n2 represents the number of data in the control mean (under the assumption of homoscedasticity, which was satisfied by the log transformation S12• S21). Because of the experimental design, equal num- bers of axillae were used for antiperspirant and control therefore ns = n2. The above expression therefore reduces to where S 2is the emr in the ANOVA. Therefore ./2(0.0212) S• = • ]• - 0.0594 *95% confidence limits used in this way are indicators of the precision of the test but a posterJori, do not imply a probability that the population mean is included in the in- terval. This interpretation can only be used a priori, when one can say that (if (l-a)----- 0.95) the population mean will be included in 19 out of 20 identical experiments. A posteriori, the mean e.'fiaer is or is not included (12), and a probability estimate is in- appropriate.
Purchased for the exclusive use of nofirst nolast (unknown)
From: SCC Media Library & Resource Center (library.scconline.org)