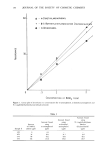
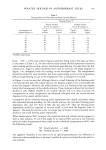
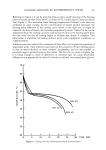
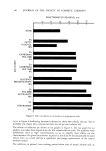
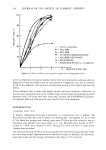
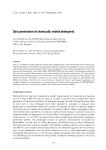
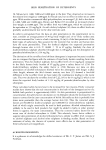
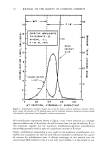
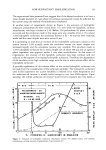
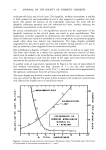
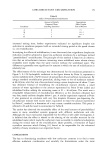
148 JOURNAL OF THE SOCIETY OF COSMETIC CHEMISTS NONE 5% CETYL ALCOHOL 10%, 2% CA R B OWAX PEG 1000 4.% • 2% --t CARBOWAX PEG 1540 co 4% 2% GLYCEROL MONOSTEARATE 10% 5% PEG 6000 DISTEARATE 10% 5% STEARAMIDE 10% PENETROMETER READING, mm I I I I I I Figure 9. Effect of additives on the hardness of antiperspirant sticks. curve in Figure 8 (indicating increased softness) at about 60% volatile silicone. This is probably one reason why commercial sticks do not go much above 50%. The r• effects of '" ' ' bar ' "' •" acminves are snown as graphs in bar graph c_ no r•gure 9. lne additive was taken from Figure 8 for the 50% volatile silicone stick. The additives were deliberately used at high concentrations so as to amplify their effects on the characteristics of a given formulation. In practice, less than 5% would probably be used which, even so, could still be a significant percentage replacement of the stearyl alcohol content. The additives, in general, have melting points below that of stearyl alcohol and, as

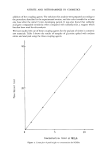
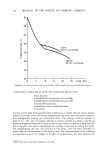
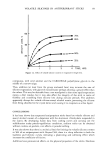
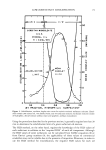
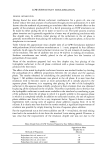
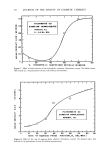
VOLATILE SILICONES IN ANTIPERSPIRANT STICKS 149 might be expected, they increased the softness of the sticks, sometimes to a considerable extent. It should be noted, however, that these additives are solids or semi-solids and they contribute to the •natrix of the stick. The softness obtained by dilution with a liquid, such as volatile silicone, detracts from the matrix and creates excessive softening, as indicated by the inflection of the curve in Figure 8. In Figure 9, it can be seen that the degree of softening is more dependent on the type of additive rather than its concentration, except possibly for cetyl alcohol and glycerol monostearate. The former gave the least softening effect and showed some variation with concentration. Its penetrometer readings were closest to those of the base stick. This probably reflects its chemical similarity to stearyl alcohol, differing by only two carbon atoms in the chain. The two CARBOWAX polyethylene glycols gave ahnost identical penetrometer readings and, as far as hardness is concerned, there appears to be no difference between the two. In the total range of Figure 9, they would be ranked as moderate in softness. As mentioned above, glycerol monostearate produced the most unusual sticks, with excessive syneresis at 5% and none at 10%. Sticks made up with 2% were uniform and nonrunning, and these were used for the lower concentra- tion in place of the 5% mixtures. The softening was dependent on concentration (Figure 9), with the higher amount (10%) imparting a higher penetrometer reading. Polyetheylene glycol distearate formed a cloudy melt and showed a step pattern in the cooling curve, both of which indicate insolubility. It is probably contributing to softness as a separate phase in fact, it produced the second softest stick in the series. Stearamide produced the softest stick of all. Although it had the highest melting point, it is itself softer than stearyl alcohol and, if it forms a solid solution with stearyl alcohol as indicated by the cooling curve, its effect on softness could be amplified thereby. Overall, the additives can be ranked as follows in terms of imparting increasing softness: Cetyl Alcohol Glycerol Monostearate CARBOWAX polyethylene glycol 1000 CARBOWAX polyethylene glycol 1540 Polyethylene glycol 6000 distearate Stearamide Softening B. LUBRICITY A number of techniques were investigated for determining the lubricity of the surface of suspensoid sticks, such as a rotating probe (9), the Brookfield viscometer and a sliding friction tester. Of these, the latter was found to be the most effective. Weighted sticks were drawn across a holland cloth (starch-impregnated linen) surface with a constant speed electric motor, and the force required to move the stick was measured with a strain gauge. Our objective here was not to duplicate tactile effects on skin, but to devise a method for measuring reproducible differences in drag under constant test conditions. Each formulation was made up twice and coefficients of friction were determined on sticks cast from them. The average coefficients are plotted in Figures 10 and 11. The coefficients of friction for varying silicone content (without additives) are plotted in Figure 10. It can be seen that there is a pronounced increase in the coefficient of
Purchased for the exclusive use of nofirst nolast (unknown)
From: SCC Media Library & Resource Center (library.scconline.org)