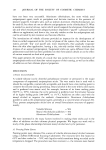
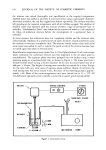
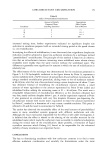
NITRITE AND NITROSAMINES IN COSMETICS 129 water and 1 ml of solutions B, B' or B". Standard calibration curves were run daily at the 100- to 900-ppb level. High pressure liquid chromatography analyses were performed using a Perkin-Elmer Model 1220 equipped with a 30-gl loop and LC55B Variable Wavelength Detector, monitoring the eluent at 234 nm. Standard solutions of NDE1A were prepared in 60:40 V/V methanol:H20. Solutions of the alkanolamides were prepared at a 50%, W/V concentration in 60:40 methanol:water. The column used for separation was a Perkin-Elmer octadecylsilane (O.D.S.), 0.46 cm I.D. by 25 cm. The mobile phase was 60:40, V/V methanol: water with a flow rate of 1.5 ml/min. RESULTS AND DISCUSSION NITRITE ANALYSIS Nitrosamines are formed by the reaction of amines and amine salts with a nitrosating agent, usually nitrite. Since nitrite is not added to the finished products found to contain NDEIA, it is possible that nitrite could be a contaminant of the raw materials used in manufacturing. For this reason, it would be advantageous to have a simple colorimetric test for nitrite capable of determining ppb levels. The most sensitive method used today is fluorescence spectroscopy. However the most commonly used method has utilized the Griess reagent. This is a colorimetric method based on the reaction of nitrite and sulfanilic acid to form the diazonium salt, followed by coupling with 1-naphthylamine. This coupling agent is listed by OSHA as a suspect carcinogen and, more recently, has been substituted by N-l-naphthylethylenediamine. It is known that coupling of diazonium salt with aromatic compounds occurs by attack of the diazonium salt on the activated para positions of the aromatic ring. G G G • • I/•.•... •' ••, H+ '•"'G' C.'
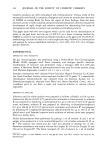
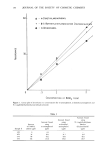
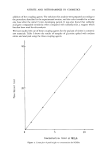
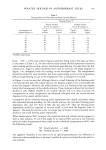
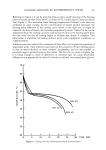
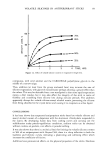
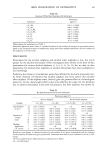
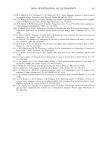
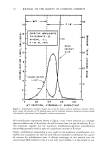
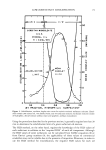
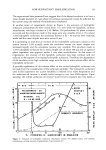
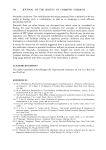
+ArN2• H N = N Ar N = N -- Ar Where G = --OH G' = --NH2 --N(CH3) 2 We have found that two couplers, m-aminophenol and m-dimethylaminophenol, both having highly activated para positions to the hydroxyl group, can be used to determine nitrite at a detection limit of 10 ppb. These reagents appear to be stable with time, with the m-dimethylaminophenol giving higher absorbance readings over the range studied. Figure I is a linear plot of absorbance vs. concentration for the three coupling reagents, obtained on a Beckman Model 25 spectrophotometer. The data was generated using disposable cuvettes (1 cm) and gave comparable results when compared with a matched set of quartz cells. The presence of nitrite was confirmed by the addition of ascorbic acid to the samples and observing zero absorbance after the

130 JOURNAL OF THE SOCIETY OF COSMETIC CHEMISTS 6O • - M-DIMETHYLAMINOPHENOL I.LI U 3O + - N-]-NAPHTHYLETHYLENED!AMINE DIHYDROCHLOR O - M-AM•NOPHENOL o ,5 1 2 CONCENTRATION OF NAN0 2 (PPM) Figure 1. Linear plot of absorbance vs. concentration for m-aminophenol, m-dimethylaminophenol and N-l-naphthylet hylenediamine dihydrochloride. Table I Sample // Amount of NaNO2 added (ppb) Amount found using m-aminophenol (ppb) Amount found Amount found using using N-l-naphthylethylene- m-dimethyl- diamine aminophenol dihydrochloride1 (ppb) (ppb) 1473 0 0.3 -- -- 1673 34 38.3 31.7 39.7 1773 68 64.2 59.9 68.1 1573 136 141.6 155.0 138.7
Purchased for the exclusive use of nofirst nolast (unknown)
From: SCC Media Library & Resource Center (library.scconline.org)