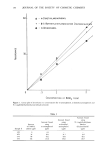
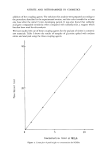
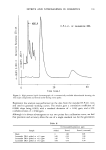
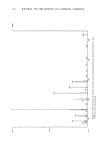
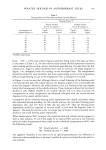
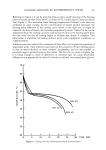
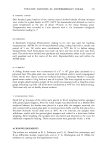
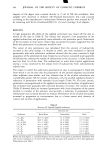
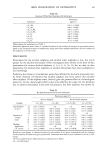
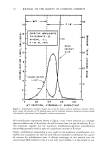
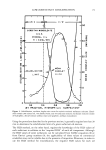
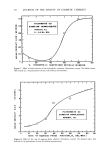
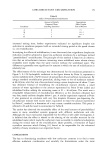
NITRITE AND NITROSAMINES IN COSMETICS 133 z o o_ • NDELA HiP,L,C, OF LAURAMIDE DEA 20 40 TIME (MIN,) Figure 3. High pressure liquid chromatograph of a commercially available alkanolamide showing the two major components and several earlier eluting minor peaks. Regression line analysis was performed on the data from the standard H.P.L.C. runs and used to generate working curves. The results gave a correlation coefficient of 0.9998, slope being 0.2829, with a standard deviation of + 0.263 ppm, and a 95% confidence limit of + 0.560 ppm. Although it is always advantageous to run two points for a calibration curve, we feel that precision and accuracy allow the use of a single standard run for the generation Table II N-Nitrosodiethanolamine, ppm Sample Added Found Found (corrected) Blank Lauramide DEA spiked at -•1.5 ppm Lauramide DEA spiked at ---3.3 ppm Lauramide DEA spiked at -•5.0 ppm 0 4.60 0.05 1.68 6.30 1.60 3.36 7.70 3.15 5.04 9.30 4.70

134 JOURNAL OF THE SOCIETY OF COSMETIC CHEMISTS
Purchased for the exclusive use of nofirst nolast (unknown)
From: SCC Media Library & Resource Center (library.scconline.org)