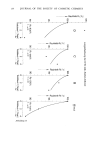
186 JOURNAL OF THE SOCIETY OF COSMETIC CHEMISTS film with a TFML of around 2.0 mg/cm2/hr. This was done primarily to achieve a high signal level to be able to detect subtle occlusion changes. Secondly, it was representa- tive of the rates of such skin areas as the back of the hand, forehead, etc., as reported by Baker and Kligman (12), and of extracted stratum corneum such as reported by Rieger and Deem (9). Figure 3 shows the effect of temperature on the trans film moisture loss rate TFML) at 0% RH and at 20% RH. This dependency follows the expected In TFML vs. øC which has been shown for human stratum corneum (1, 4, 7). As a matter of convenience, we have chosen to report our results at 30øC for the remainder of this paper. PERCENTAGE OF REDUCTION BY MATERIALS Figure 4 shows the TFML baseline rates for polymeric substrate alone, polymeric substrate with Cream A (a commercially available emollient cream) and polymeric substrate with USP Petrolatum. From these results, we have calculated the percentage of reductions in TFML attributable to Cream A and USP Petrolatum and these are displayed in Figure 5. lOO 9o :• 80 {• 70 0 60 5o 40 3o 2o 10 o- o o lO 20 30 40 50 % RELATIVE HUMIDITY Figure 5. The per cent reduction in the Trans Film Moisture Loss rate of the polymeric substrate for USP Petrotatum (&) and Cream A (©), as a function of relative humidity.

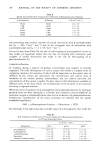
TRANSEPIDERMAL MOISTURE LOSS 187 We have long felt that 0% RH, which was originally a limitation in our in vivo and in vitro experiments, was an unrealistic condition. While relative humidity can be low in the winter, it generally does not achieve 0%. We have recently concluded that confining our experiments to 20% RH is expeditious and more representative of occlusivity under general winter-dry conditions we have, however, chosen for the purpose of this paper to show results at 0% and 20% RH to illustrate differences in performances due to changes in relative humidity. Table I shows the results achieved for USP Petrolatum, creams, lotions and raw materials. We have found the reproduci- bility of this method to be + 4% reduction. THE EFFECT OF RELATIVE HUMIDITY ON THE % REDUCTION OF PRODUCTS AND RAW MATERIALS Figure 6 shows a scattergram of the percentage of reduction at 20% RH plotted vs. the percentage of reduction at 0% RH for many of the samples which we have evaluated in our laboratories. The diagonal line is the "no effect line" or the points where the per- centage of reduction in TFML at 0% RH and 20% RH are equal. Most samples fall above Table I The Percentage of Reduction in Trans Film Moisture Loss Rate (TFML) for Several Products and Raw Materials at 0% RH and 20% RH Reduction 0% RH 20% RH USP Petrolatum, Brand A Cream • A B C D E F Lotion 2 A B C D E F Mineral Oil (Heavy) Mineral Oil (Light) Lanolin Turtle Oil Lanolin Oil Avocado Oil Sweet Almond Oil Safflower Oil Isopropyl palmitate Glycerin, anhydrous Brand B Brand C 99 98 99 98 96 98 29 38 19 9 38 57 3 41 7 21 0 12 15 26 -3 9 11 6 -5 7 17 28 30 31 23 29 76 83 34 38 42 31 39 59 31 37 12 17 --9 7 -- 26 -- 19 •Creams are emollient creams which are commercially available. 2Lotions are oil-in-water emollient lotions which are commercially available.
Purchased for the exclusive use of nofirst nolast (unknown)
From: SCC Media Library & Resource Center (library.scconline.org)