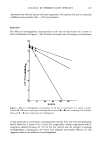
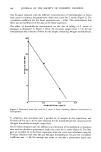
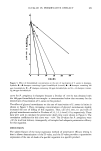
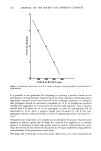
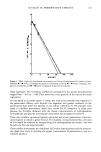
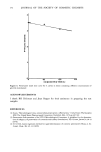
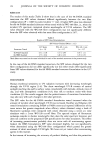
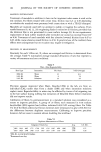
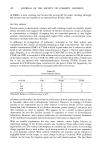
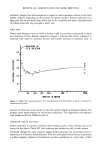
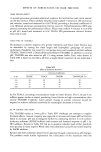
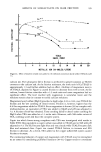
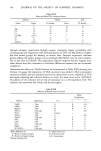
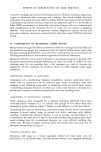
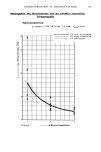
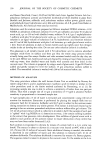
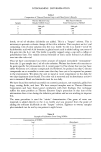
188 JOURNAL OF THE SOCIETY OF COSMETIC CHEMISTS stearamine (DMSA) was puzzling. At 0.1% AI, values are comparable to SLS and, with the extreme rinsing imposed by water measurements, friction decreases although not to levels expected on the basis of practical combing. CONCENTRATION EFFECTS The friction test appears suited for acquiring fundamental information leading to a better understanding of frictional effects but a practically oriented set of test conditions must also be provided to predict results of use tests. Obviously preceding experiments have not satisfied this objective but have emphasized concentration of surfactant at the rubbing interfaces to be an important test variable. Evidently for certain cationics, friction passes through a minimum as concentration is reduced on the hair surface. To better define concentration effects and especially friction minima, bleached fibers were measured in buffered solutions at various low surfactant concentrations. Results are complied in Table IX and graphed for CTAB in Figure 2. Table IX Concentration Effects % Concentration, F.C. Cationic pH-Buffer 0.20 0.10 0.05 0.01 0.005 0.001 01 CTAB 3.6 Acetate -- .39 .38 .30 .25 -- .54 CTAB 3.6 Citrate -- .36 -- .28 .25 -- -- CTAB 9.3 Carbonate .34 .30 .31 .28 .35 -- .49 DMSA 3.6 Acetate -- .39 .41 .32 .31 .29 .54 SA 3.6 Acetate -- .39 -- -- -- .21 .54 SAAC 3.6 Acetate -- .45 .40 .39 -- .28 .54 Q-18 3.6 Acetate -- .17 -- -- -- .19 .54 FPAC 3.6 Acetate .19 .19 -- .17 -- .27 .54 1Fibers in .02 M buffer solutions, no surfactant. Friction minima are evident for CTAB under the test conditions. Exchange of citrate for acetate buffer had no significant effect although sorption is known (31) to increase marginally with citrate buffer. Replacing hard rubber with wool produced a lower curve for CTAB but with a similar minimum. Both DMSA and SAAC produce minima and stearamine (SA) which appeared in combing tests to have an advantage over the tertiary amine DMSA, also shows a minimum but at a lower friction value. The two higher molecular weight surfactants, Quaternium-18 (Q-18) and FPAC in Table IX have low friction at all test concentra- tions. Additional data is needed to detect reliably whether friction minima exist for these two surfactants. Results of sorption (31) are pertinent to the frictional behavior of these cationics. CTAB for example sorbs in relatively large amounts to hair with appreciable penetration into the fibers but, upon dilution of the contact solution, readily desorbs. Unreported data (33) show that cationics such as SAAC sorb at lesser amounts, penetrate more slowly, but have greater resistance to desorption. Other cationics, for

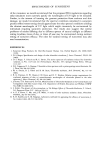
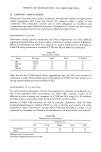
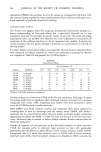
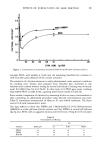
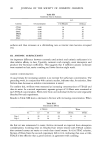
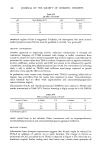
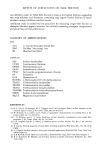
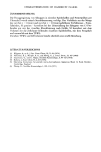
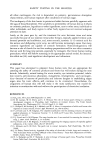
EFFECTS OF SURFACTANTS ON HAIR FRICTION 189 0.4 0.3 HARD RUBBER o WOOL 0.2 o.,[ 0 I I I I I I I I I I .02 .04 .06 .08 . I0 .20 CTAB CONC. (g/100] Figure 2. Concentration of cetrimonium bromide (CTAB) in 0.02 M buffer solutions at pH 3.6. example FPAC, sorb initially at levels near the measuring threshold but continue to sorb even after gross dilutions of the contact solutions. The existence of a friction minimum is easily substantiated under practical conditions by combing tests. Tresses were prepared from bleached hair, immersed in test solutions and combed without rinsing by several individuals. Combing was obviously easier for 0.001% than for 0.1% SAAC. In other tests, 0.1% FPAC gave easier combing than 0.001% FPAC or 0.001 SAAC, agreeing with friction results in Table IX. Since routine comparison of cationics by measuring friction at many concentrations is time consuming, an abbreviated procedure using selected concentrations was tried. Table X summarizes measurement of fibers at 0.1 and 0.001% surfactant. The fibers used at 0.1% were remeasured in water. The data suffices to show that DMSA and 2-Hydroxyalkyl (C15-18) diethanolamine (HADEA) at acidic pH have friction minima and that DMSA at neutral pH behaves like Q-18 or FPAC with no apparent minima and low friction. Using the 0.1% solutions Table X Concentration and Rinsing F.C. Cationic Buffer pH 0.! 0.001 Water DMSA 3.6 .39 .29 .25 DMSA 6.9 .20 .21 .22 HADEA 4.2 .35 .22 .25
Purchased for the exclusive use of nofirst nolast (unknown)
From: SCC Media Library & Resource Center (library.scconline.org)