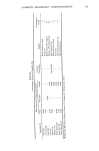
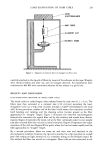
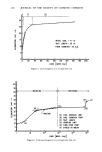
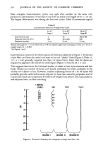
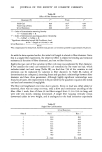
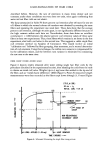
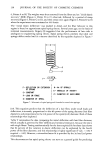
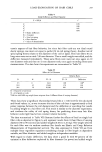
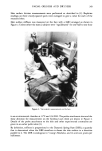
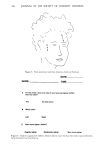
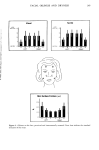
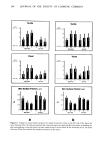
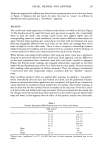
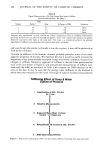
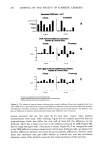
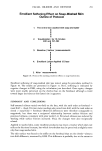
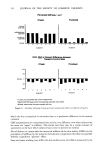
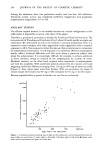
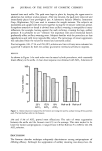
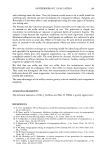
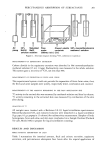
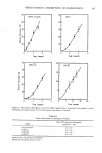
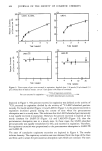
FACIAL OILINESS AND DRYNESS 247 Subjective appraisal of stiffness was derived from questionnaires such as the one shown in Figure 4. Subjects did not touch the skin, but tried to "sense" its stiffness by movement and by grimacing: a "kinesthetic" appraisal. RESULTS The tactile and visual impression of oiliness varied about two-fold on the face (Figure 5). The forehead and the nasal fold areas were perceived as equally oily, considerably more so than the cheek. The average tactile scores were slightly higher than the corresponding scores for visual assessment, but the relative differences were about the same. Friction meter readings also varied about two-fold, with the forehead and nasal fold only marginally different from each other on the cheek, the readings were about twice as high as on the oilier areas. There is thus a reciprocal relationship between subjectively perceived oiliness and skin surface friction, consistent with the findings of a recent study (1) in which such measurements were made on the forearm. When the face was washed with ordinary bath soap and water, there was a significant decrease in perceived oiliness for both tactile and visual appraisal, and the differences on the three anatomical sites--forehead, nasal fold, and cheek--tended to disappear (Figure 6a). Friction meter readings also changed substantially, especially on the oilier (nasal fold and forehead) areas of the face. Note that the skin surface friction increased after washing, while perception of oiliness decreased. Thus, the changes, instrumental vs perceived, were also reciprocally related, consistent with the "baseline" observa- tions. Since emollient products often are applied after washing, we applied a "non-greasy" lotion immediately after the face was washed and dried, and we performed measure- ments ten minutes after lotion application was completed. In Figure 6b we contrast the values obtained on emollient-treated washed skin to baseline values before washing. It may be seen that the skin surface friction increased on the oily areas of the face, much as it did on skin just washed with soap and water. Perceived oiliness also decreased, but the changes were less marked than those observed on skin which was just washed with soap and water. It thus appears that the effect of the product residue was discernible, Table I Dynamic Spring Rate (DSR) Measurements on the Cheek and Forehead DSR, g/mm* Cheek Forehead Mean S.D. Range 5.2, 5.5 5.8, 9.7 3.5, 3.8 10.6, 11.1 4.7, 3.3 11.7, 7.1 6.7, 7.4 13.2, 20.7 7.5, 4.7 20.9, 15.5 4.9, 6.7 9.7, 14.8 5.3 12.0 1.4 4.9 3.3-7.5 5.7-20.9 *Subjects were "equilibrated" at 22øC, 15% RH. Each pair of values represents contralateral sites on one subject.

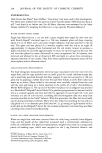
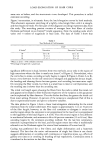
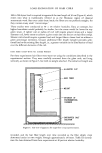
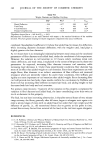
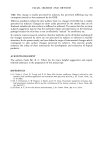
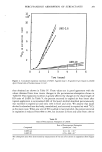
248 JOURNAL OF THE SOCIETY OF COSMETIC CHEMISTS Table II Topical Maneuvers per se Do Not Change Skin Surface Stiffness (Some Emollients Have "No Effect") DSR Subject Before* After % Change in DSR Subjective 1 5.9 6.1 3% Same 2 5.7 5.5 - 4% Same 3 6.7 6.4 - 4% Same *Subjects were "equilibrated" at 22øC, 15% RH for "before" measurement. Then an emollient cream product previously shown to have no effect on the DSR was applied. "After" was 5 minutes after product was applied. Subjective assesments were made at the same time. The cream is a commercial product the principal ingredients are safflower and sesame seed oils, glycerin, fatty acids, and elastin. and even though this residue technically is not oily or greasy, it may still be perceived as such by the consumer. Tautness or stiffness of the stratum corneum probably precedes some of the more apparent symptoms of dry skin. We therefore felt that it would be useful to know the magnitude of any instrumentally-measured change that would correspond to perceived changes in stiffness. Subjective appraisal of stiffness is derived from questionnaires such as the one shown in Figure 4, and instrumental measurements of stiffness were done with the GBE, as described. In Table I, we compare the DSR obtained on two sites on the face. It may be seen that the average value (stiffness) on the forehead is about twice that measured on the cheek. The range of value on forehead measurements Stiffening Effect of Soap & Water Outline of Protocol 1. Equilibration at 22C, 15% RH for I hour I I I I 2. Baseline Measurements I I I 3. Soap and Water Wash 1/2 Face "control" 1/2 rinsed only I ! I I 4. Reequilibrate 10 minutes at 22C, 15% RH I I I I 5. After-wash measurements Figure 7. Protocol for assessing the effects on skin surface stiffness of washing with soap and water.
Purchased for the exclusive use of nofirst nolast (unknown)
From: SCC Media Library & Resource Center (library.scconline.org)