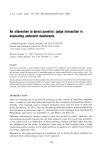
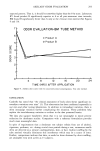
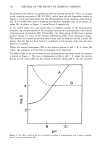
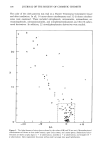
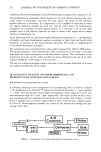
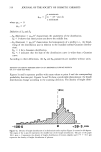
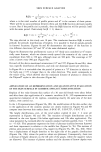
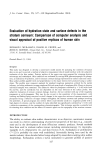
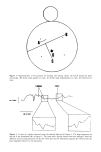
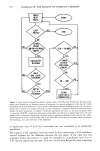
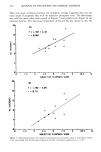
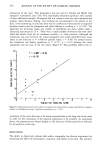
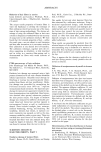
332 JOURNAL OF THE SOCIETY OF COSMETIC CHEMISTS •/ INPUT NEXT POINT NO NO YES ERLEULRTE HINIHUH NO D/W • B. BB2f YES WITHIN PREVIOUS NO RZ • 9Bf YES STORE LOERTION & PRRRHETER5 Figure 5. Flow chart of computer program to detect cracks. The following describes the decision points which were derived by an iterative process of adjusting the various parameters such that all visibly identifiable cracks were detected: (1) Level point--determines if there is a following point 30-50 microns distant that is within 0.75 micron vertically, (2) local minimum--eliminates areas with hills and valleys within the above boundaries, (3) depth--eliminates depressions less than 2.2 microns and greater than 4.4 microns, (4) D/W--eliminates depressions whose depth-to-width ratio is greater than 8.2%, (5) crack within crack--eliminates depressions contained within a previously identified crack, and (6) A%--elim- inates depressions whose cross-sectional area is less than 90% of the area of a triangle whose vertices are the beginning, end, and minimum of the depression. of significance of p • 0.05 for a two-tailed test was considered to be statistically significant. The equality of the regression lines was tested by first constructing a 95% confidence interval estimate for the difference between the two slopes. If the value zero was contained within this interval, it could be concluded at a significance level of p = 0.05 that the slopes were the same. This was true for both Ra and Rz when comparing

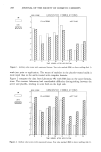
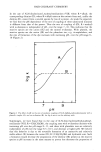
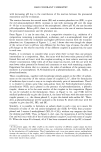
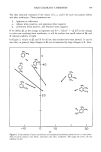
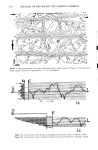
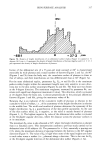
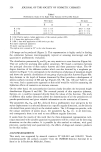
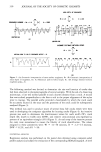
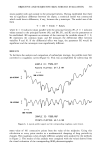
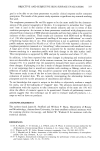
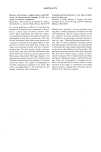
OBJECTIVE AND SUBJECTIVE SKIN SURFACE EVALUATION 333 traces parallel with and normal to the principal furrows. Having established that there was no significant difference between the slopes, a statistical model was constructed which could detect differences, if any, between the y-intercepts. The model was of the form Y = B0 + B i(X) + B2(Z), where Z = 0 indicates values parallel with the principal furrows (P), Z = 1 indicates values normal to the principal furrows (N), and B0, B 1, and B2 are the parameters to be established. B0 represents an estimate of the intercept for variables where Z = 0, B1 represents the common slope, and B2 measures the differential effect between variables P and N. If the differential effect was large, the parameter B2 would be significant and the intercepts were significantly different. RESULTS To facilitate the analysis and comparison of surfanalysis tracings, the profiles were first converted to roughness curves (Figure 6). This was accomplished by subtracting the 2• MIERON5 I SAMPLE I0: PSBõ.OAT POINTS PLOTTEO: 0-7.5 MM •• I I MICRONS I S• MIFRON5 SAMPLE ID: PSBg. RUF POINTS PLOTTED: 0-7.5 MM Figure6. A typicalprofile(upper) andthecorrespondingroughnesscu•e(lower). mean value of 10! consecutive points from the value of the midpoint. Using this calculation at every point results in a mathematical damping of long periodicity changes. The roughness curves of eight different samples were analyzed by the methods in Figure 2. The results of this analysis were compared with the values derived from the visual evaluation of the corresponding SEM photomicrographs.
Purchased for the exclusive use of nofirst nolast (unknown)
From: SCC Media Library & Resource Center (library.scconline.org)