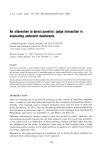
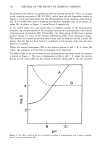
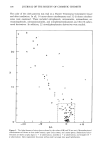
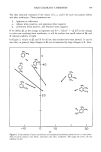
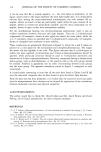
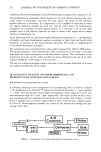
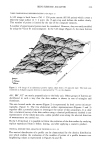
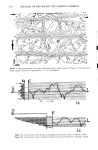
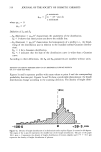
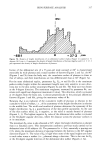
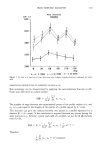
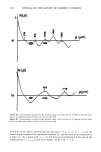
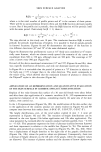
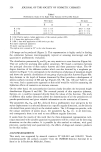
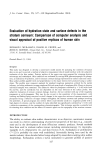
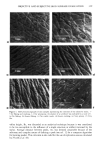
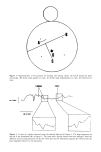
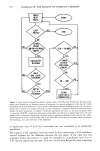
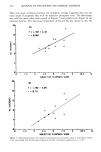
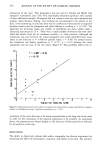
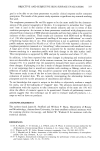
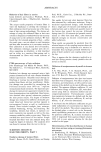
330 JOURNAL OF THE SOCIETY OF COSMETIC CHEMISTS HEI:IH DEPTH OF ROUF-d'•qESS HI:IXU'4UIq • TO VRLLEY RO• NEI{•[I' - R'r Rz = I•N •. Zx N = 13S _ Figure 2. (A) Geometric interpretation of mean surface roughness, Ra. (B) Geometric interpretation of mean depth of roughness, Rz. (C) Maximum peak-to-valley height, Rt. (D) Average distance between roughness peaks, At. The following method was devised to determine the size and location of cracks that had been observed in photomicrographs of several samples. With the aid of a dissecting microscope, a line was scribed parallel to and a known distance from a crack. A second line was scribed perpendicular to the first to aid in the proper alignment of the stylus prior to tracing. The parallel scribe provided a benchmark by which the crack could be accurately located in the trace and the geometry of the crack could be subsequently analyzed (Figure 3). This method was used to produce traces of several bona fide cracks which were then used in developing the computer algorithm for locating cracks (Figure 4). An iterative process was used to determine the discriminator values for crack width (W), crack depth (D), depth to width ratio (D/W), and relative cross-sectional area expressed as percent of an equivalent triangle (A%) (Figure 5). At each step of the iterative process the casts were reexamined to insure the fidelity of crack identification. The values assigned to these parameters were: W = 32-50 microns, D = 2.2-4.4 microns, D/W 8.2%, and A% 90. STATISTICAL ANALYSIS Regression analysis was performed on the paired data obtained using computer-aided profile analysis and subjective evaluation of the corresponding SEM photograph. A level

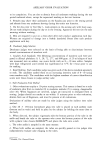
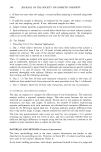
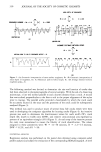
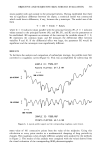
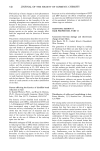
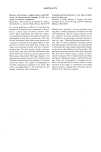
Figure 3. Representation of the protocol for locating and tracing cracks. (A) Crack located by light microscopy. (B) Scribe mark parallel to crack. (C) Scribe mark perpendicular to crack. (D) Direction of trace. Figure 4. A trace of a replica obtained using the method depicted in Figure 3. The large depression on the left is the benchmark (B) in Figure 3. The crack and a typical furrow have been enlarged. Note the different cross-sectional geometry of the two. Note also that for illustrative purposes the vertical scale has been magnified relative to the horizontal.
Purchased for the exclusive use of nofirst nolast (unknown)
From: SCC Media Library & Resource Center (library.scconline.org)