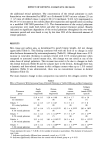
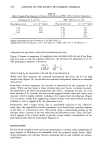
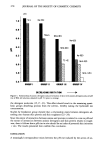
EFFECT OF RETINYL PALMITATE ON SKIN 237 the additional retinyl palmitate. The concentration of the retinyl palmitate in each formulation was determined by HPLC on a Lichrosorb Si 60/5 micron column (25 cm X 4.5 mm id) (Alltech Assoc.) using 0.4% (v/v) methanol / 0.4% (v/v) isopropanol in 99.2% (v/v) isooctane as the mobile phase after separation and saponification according to a modified USP XXI procedure (12). The determinations of the retinyl palmitate concentration were made both before and after the animal treatment period. Results indicated no significant degradation of the retinyl palmitate throughout the two-week treatment period and were found to vary by less than 20% of the theoretical amount of retinyl palmitate. RESULTS Skin tissue per surface area, as determined by punch biopsy weight, did not change appreciably (Table I). This finding correlates well with the little or no change in total skin thickness determined by micromorphometry (Table II). Although there was a 21% increase in total skin thickness in animals treated with 0.1% retinyl palmitate when compared to untreated control mouse skin, this change was not noted at any of the other doses of retinyl palmitate. This increase was noted to be due to changes in both the dermal thickness (Table II) and the adipose layer in the dermis. Although there was a dramatic and dose-related increase in skin collagen content when up to 1.5 % retinyl palmitate (Table I) was administered, there was no concomitant increase in dermal thickness (Table II). The most dramatic change in skin composition was noted in the collagen content. The Table I Effect of Treatment With Increasing Doses of Retinyl Palmitate in Visible Difference on Skin Composition Collagen Punch Protein DNA content Treatment weight content content (nmole HYP) group (mg/punch) (mg/punch) (Ixg/punch) (punch) Control 11.8 - 0.5 1.28 _ 0.09 44.2 - 3.7 82 _ 20 (no treatment) (8) (8) (8) (7) Vehicle q- 12.1 - 0.5 1.37 - 0.07 51.3 - 2.3 67 - 8 0% retinyl palmitate (8) (8) (8) (8) Vehicle q- 12.7 - 0.4 1.71 -+ 0.13"** 62.1 ñ 4.3*'** 126 - 18'* 0.1% retinyl palmitate (8) (8) (8) (8) Vehicle q- 13.1 ñ 0.5 1.71 - 0.10"** 57.7 ñ 3.2* 135 ñ 27** 0.5 % retinyl palmitate (8) (7) (8) (8) Vehicle + 12.5 - 0.5 1.81 - 0.10"** 54.2 ñ 4.4 153 - 15"** 1.5% retinyl palmitate (8) (8) (8) (8) Vehicle q- 12.9 ñ 0.4 1.70 ñ 0.08*'** 66.5 ñ 3.4"** 134 ñ 14"** 5.0% retinyl palmitate (8) (8) (8) (8) Values represent the mean ñ S.E.M. of the number of animals in parentheses. The diameter of each punch was 6 mm. * Indicates significantly different from untreated control at p • 0.05. ** Indicates significantly different from the control-vehicle-treated group at p • 0.05.

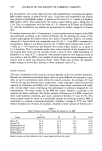
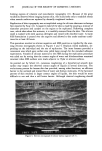
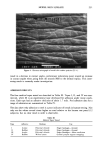
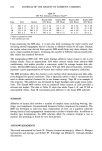
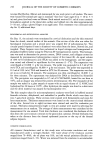
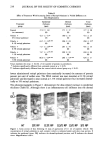
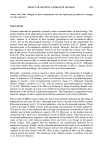
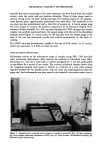
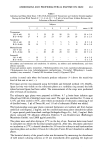
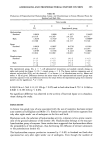
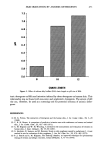
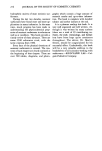
238 JOURNAL OF THE SOCIETY OF COSMETIC CHEMISTS Table II Effect of Treatment With Increasing Doses of Retinyl Palmitate in Visible Difference on Skin Morphometry Epidermal Dermal Total Treatment thickness thickness thickness group (}xm) (}xm) (}xm) Control 27.9 --- 1.8 171 --- 17 377 -+ 28 (no treatment) (8) (8) (8) Vehicle + 42.5 - 4.3* 180 --- 15 411 --- 25 0% retinyl palmirate (8) (8) (8) Vehicle + 63.5 --- 2.9"** 206 ___ 24 458 --- 25* O. 1% retinyl palmirate (8) (8) (8) Vehicle + 71.7 - 2.6*'** 201 --- 14 431 --- 15 O. 5% retinyl palmirate (8) (8) (8) Vehicle + 74.7 - 3.7"** 209 + 19 430 --- 28 1.5% retinyl palmitate (8) (8) (8) Vehicle + 86.0 --- 4.9"** 286 --- 13"** 424 - 17 5.0% retinyl palmirate (8) (8) (8) Values represent the mean --- S.E.M. of the number of animals in parentheses. * Indicates significantly different from untreated control at p • 0.05. ** Indicates significantly different from the control-vehicle-treated group at p • O. 05. lowest administered retinyl palmitate dose maximally increased the amount of protein present per unit of surface area. The DNA content was near maximal at 0.1% retinyl palmitate and decreased to near normal at 1.5% retinyl palmitate but increased dramat- ically at 5% retinyl palmitate. The photomicrographs in Figure 1 demonstrate the dose-related increase in epidermal thickness (Table II). Although there is an inflammatory cell infiltrate into the dermal E DEJ NT 0% RP 0.1% RP 0.5% RP 1.5% RP 5% RP Figure 1. Cross section of skin following 14 days of application of 0.1 ml of cosmetic vehicle. The concentration of retinyl palmitate in each cosmetic vehicle is indicated under each skin cross section. E indicates the epidermal tissue, DEJ indicates the dermal/epidermal junction, and D indicates the dermal tissue. Magnification is 80 X.
Purchased for the exclusive use of nofirst nolast (unknown)
From: SCC Media Library & Resource Center (library.scconline.org)