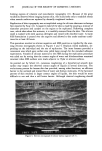
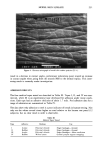
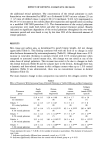
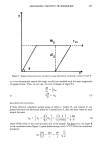
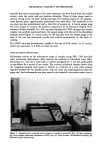
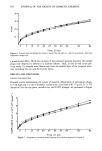
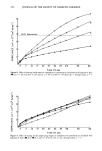
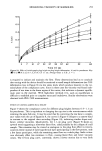
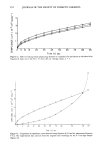
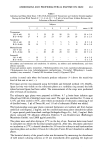
MEASURING VISCOSITY OF SEMISOLIDS 2 5 5 Table I Effect of Stress Level on Viscosity of Petrolatum and PEG 1500 at Ambient Temperature Petrolatum (21.2- 21.5 øC) F (dynes cm -2) x 10 -4 qq x 10 -6 (poise) PEG 1500 (22.2-23.2øC) F (dynes cm -2) X 10 -4 'q X 10 -6 (poise) 2.35 (81.31 g) 3.65 6.69 (231.31 g) 56.1 2.93 (101.31 g) 1.83 7.42 (256.31 g) 27.3 3.51 (121.31 g) 1.25 8.14 (281.31 g) 14.2 3.80 (131.31 g) 0.80 8.86 (306.31 g) 6.0 Sample diameter = 1.2 cm. Sample height = 0.7 cm. room for flow, thus indicating that the ideal sample plug height for our apparatus is between 0.5 and 0.9 cm. However, no significant interactions (or = 0.05) were dem- onstrated by the ANOVA test, indicating that the measured viscosities were indepen- dent of the initial sample plug height. A similar optimal range of plug heights for the viscosity determinations was also observed for PEG 1500 (Table II). EFFECT OF VARYING SAMPLE PLUG DIAMETER Figure 11 presents the compliance curves with varying plug diameters for petrolatum and again shows parallel slopes in the terminal linear regions, thus indicating similar viscosities. Varying plug diameters here is equivalent to varying the bob size while maintaining the same cup size in the rotoviscometer. The applied stress in this set of experiments was such that with increasing diameters the applied weight was increased so as to maintain a constant stress. Table III lists the obtained viscosities for both the petrolatum USP and the PEG 1500. No significant differences in the viscosity values (ix = 0.05) were seen within the range of diameters studied, excepting the largest PEG 1500 plug diameter (1.57 cm). One possible explanation for such deviation in the case of a large diameter of PEG 1500 could be the difference in the degree of anisotropy of this material as compared to petrolatum. The petrolatum matrix being more uniform due to its smaller crystals blended homogeneously with the non-crystalline surrounding (Figure 4), possibly behaved more ideally than the PEG 1500. Such behavior, it ap- pears, was more evident with a larger diameter sample because of the large mass in- volved. Table II Effect of Sample Plug Height on Viscosity of Petrolatum and PEG 1500 at Ambient Temperature Petrolatum (22.7 - 23.2øC) Plug height (cm) qq X 10 -6 (poise) PEG 1500 (21.4-21.8øC) Plug height (cm) qq X 10 -6 (poise) O.5 O.97 O.5 -- 0.7 1.06 0.7 14.1 0.9 0.87 0.9 12.6 1.1 1.1 10.6 Diameter = 1.2 cm. Applied stress levels: Petrolatum, 2.35 X 10 4 dynes cm-2 PEG 1500, 11.03 X 10 4 dynes cm -2.

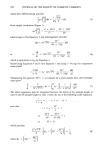
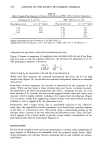
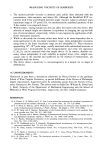
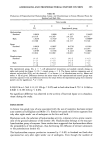
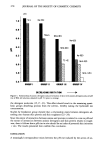
256 JOURNAL OF THE SOCIETY OF COSMETIC CHEMISTS Table III Effect of Sample Plug Diameter on Viscosity of Petrolatum and PEG 1500 at Ambient Temperature Petrolatum (21.9-22.2øC) Plug diameter (cm) qq X 10 -6 (poise) PEG 1500 (23.2-23.7øC) Plug diameter (cm) 10-6 (poise) 1.26 4.87 0.87 15.7 1.57 4.46 1.08 13.3 2.03 4.88 1.20 18.8 1.35 18.1 1.57 67.4 Sample height/diameter ratio: Petrolatum, 0.55 PEG 1500, 0.7. Applied stress levels: Petrolatum, 2.32 • 10 4 dynes cm-2 PEG 1500, 9.58 • 10 4 dynes cm -2. COMPARISON OF EQUATION 8 WITH THE PLASTOMETER EQUATION Figure 12 shows a comparison of compliance data calculated with the use of our Equa- tion 8 as well as with the equation referred in the literature for plastometer (12,13). The plastometer equation is shown as = (9) where h and ho are equivalent to H and H o of our Equation 8. While solid lines represent the converted experimental data from the 0.7-cm high sample curve (Figure 10), the dotted lines represent extrapolated values for an extended time period. From both of these equations, the viscosity is represented by the reciprocal of the slopes. While our plot shows a linear terminal slope and, hence, a constant viscosity, the plastometer plot shows increasing slope and, hence, a dropping viscosity. In a very short duration of 67 seconds, the latter model suggests infinite slope and, hence, zero viscosity, which is highly unlikely. Looking at the original chart recording also (Figure 10), we notice a steady flow suggesting a steady viscosity value which should not drop suddenly to zero as suggested by the plastometer curve. Furthermore, after a longer period, due to considerable reduction in the "effective" stress value, the original flow and the compliance curve should show a gradual cessation of the flow, or a downward curve. This would imply a phenomenal increase in the viscosity values, contrary to the zero value from the plastometer curve. Thus, our Equa- tion 8 appears to be a better model to provide a more realistic interpretation of our experimental data than the plastometer Equation 9. CONCLUSIONS For low levels of applied stress and strain measurement, viscosity values independent of time (absence of thixotropy) are obtainable with the proposed simple device. Addi- tional advantages over existing viscosity measuring devices and methods are summa- rized below:
Purchased for the exclusive use of nofirst nolast (unknown)
From: SCC Media Library & Resource Center (library.scconline.org)