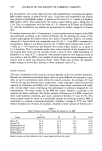
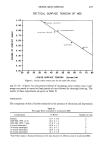
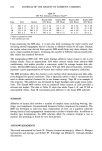
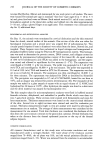
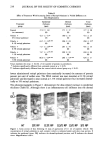
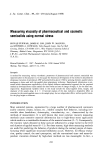
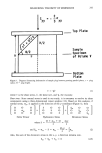
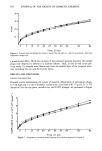
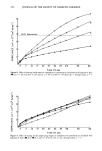
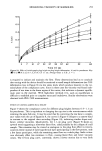
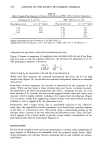
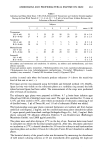
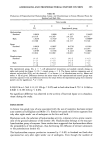
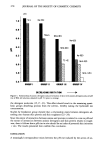
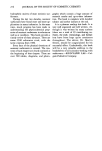
MEASURING VISCOSITY OF SEMISOLIDS 251 6. Points were selected along these curves for the values of height traveled "h," and the "H" (height remaining to be traveled) was calculated by the relationship H = (H 0 - h). Compliance values (ratio of strain/stress represented by the quantity on the left-hand side of Equation 8) were calculated for each point and plotted against time (Figure 7 subsequent Figures 8, 9, 11, and 12 were plotted similarly). The appearance of the initial curved portion of the compliance curve which represents the viscoelastic behavior of the material was discussed before, and the equation was accordingly modi- fied (1). In this paper, data only from the terminal linear portion of the plot repre- senting the linear flow of the dashpot unit of the Maxwell model (1) has been used to determine the viscosity values. On this basis, the viscosity for petrolatum from the reciprocal of the linear slope was found to be around 2.45 x 10 6 poise.* EFFECT OF VARYING INITIAL STRESS Experimental data showing the effect of various stress levels on the viscosities for petro- latum and PEG 1500 are presented in Table I. The viscosity values based on triplicate runs using three sample plugs for each run were calculated from the reciprocal of the terminal linear slopes of the compliance curves (Figure 8). The ANOVA test using a 4 x 12 factorial design with three replications for the compliance data indicate signifi- cant differences (or = 0.05) in viscosity values with application of different stress levels, consistent with the non-Newtonian nature of these materials. In Figure 8, the compliance curves obtained with the higher stress levels were seen to deviate from linearity with time in the terminal region. This could be explained by the fact that within the same time period, the "effective" stress is reduced relatively rapidly with the higher stress levels. The "effective" stress here is defined as dynamic stress at any given point of time after starting the run, and can be computed from the sample dimensions at that time. For example, with the largest stress, i.e., 38 x 10 3 dynes cm -2, the initial stress had decreased by approximately 80% to 7.6 x 10³ dynes cm -2 within 60 seconds (Figure 8), as compared to a decrease of less than 30% to 16.9 x 10 3 dynes cm -2 with the smallest stress, i.e., 23.5 x 10 3 dynes cm -2 within the same time period. Thus, in spite of starting with a higher stress value of 38 x 10 3 dynes cm -2, the "effective" stress of 7.6 x 10 3 dynes cm -2 in the former case becomes much too small within 60 seconds, as compared to 16.9 x 10 3 dynes cm -2 in the latter case where it started with a lower stress of 23.5 x 10 3 dynes cm -2. Although such stress change is inherently accounted for in Equation 8 by virtue of integration over time, the point of emphasis here is that in the case of the higher initial stress, the "effective" stress eventually becomes too small too quickly to maintain the desired uniform deformation, ultimately approaching a zero flow. This situation is anal- ogous to the yield value with conventional instruments where a minimum level of stress * Equation 8 is based on the assumption of small sample deformation such that, as 0 • 0, tan 0 • 0, a condition usually valid with stress application in the linear viscoelastic range. The data in this paper have been collected in the non-linear viscoelastic range with rather large sample deformation for the purpose of determining whether the results with this device are independent of such parameters as sample height and diameter. Consequently, the viscosity values shown here and in the tables elsewhere should not be consid- ered "ground state" viscosities as was the case in the previous publication (1). In that publication, the values were obtained in the linear viscoelastic range and were stress-independent. In the non-linear visco- elastic range (as here), the viscosity values are not expected to be stress-independent.

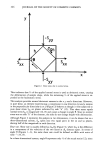
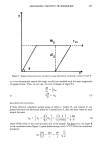
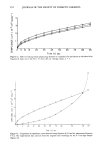
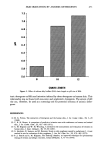
252 JOURNAL OF THE SOCIETY OF COSMETIC CHEMISTS 50% deformolion ! I 2 7 12 17 22 27 32 37 42 52 62 Time (I) sec Figure 8. Effect of varying initial stress on compliance for petrolatum as calculated with Equation 8. Key: (O) 23.5 X 10³ (]--]) 29.3 X 10³ (/•) 35.1 X 10³ (O) 38.0 ( 103 dynes cm -2. Average values, n = 3. i i i i i I i i 2 7 12 17 22 27 32 37 42 52 62 Time (t) sec Figure 9. Effect of varying initial sample plug height on compliance for petrolatum as calculated with Equation 8. Key: (I) 0.4 (O) 0.5 (A) 0.7 ([]) 0.9 (O) 1. ! cm. Average values, n -- 3.
Purchased for the exclusive use of nofirst nolast (unknown)
From: SCC Media Library & Resource Center (library.scconline.org)