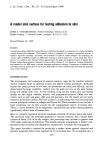
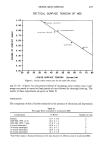
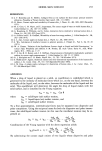
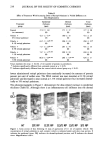
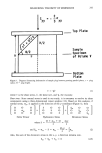
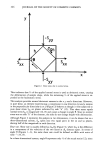
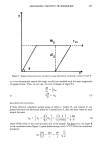
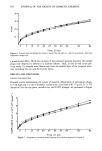
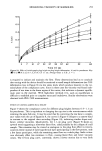
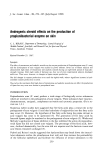
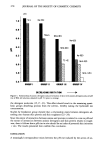
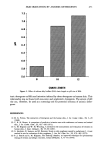
MEASURING VISCOSITY OF SEMISOLIDS 2 5 3 0.6 0.5 0.4 0.25 0.2 O.I i i i 2 7 12 17 22 27 32 37 42 52 62 Time (t) sec Figure 10. Effect of initial sample plug height on plug height deformation, h (cm) for petrolatum. Key: (I) 0.4 (0) 0.5' (A) 0.7 ([•) 0.9 (O) 1.1 cm. Average values +_ S.D., n = 3. is required to initiate and maintain the flow. These observations lead us to conclude that testing with the device should be restricted to small sample deformations (see 50% deformation line in Figure 8) via low stress levels which produce linearity in the ter- minal phase of the compliance curve. Since in these cases the viscosity was found inde- pendent of test time in the linear region of the curves, this indicates a dynamic equilib- rium state in the material. With high-shear methods (11), such an equilibrium is difficult to establish prior to complete structural breakdown. Similar observations were obtained with PEG 1500 measurements. EFFECT OF VARYING SAMPLE PLUG HEIGHT Figure 9 shows the compliance curves for different plug heights between 0.4-1.1 cm for petrolatum. This is equivalent to changing the cup size in the rotoviscometer while retaining the same bob size. It may be noted that by converting the raw data to compli- ance values with the use of Equation 8, the curves in Figure 9 collapse to a narrow band in contrast to the original chart recording (Figure 10), indicating similar slopes and, hence, similar viscosities. Qualitatively, the 1.1-cm plug curve (Figure 9) shows an upward trend suggesting a somewhat faster flow, aided possibly by the collapse of a tall sample. This situation may be viewed as analogous to the plug flow effect in rotovis- cometers where instead of each hypothetical layer participating in the flow process, only a few layers participate, while the remaining mass flows as a whole plug. Such a situa- tion obviously offers less resistance to flow, causing faster flow and lower viscosity values. The 0.4-cm plug curve, conversely, shows a slower motion due to very little

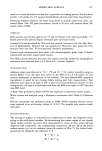
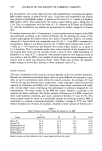
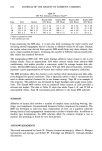
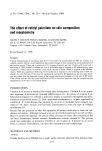
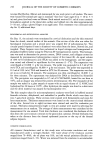
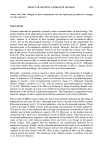
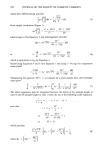
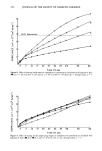
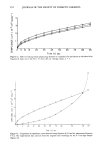
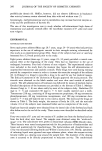
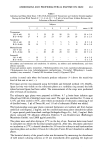
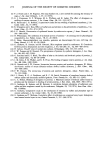
254 JOURNAL OF THE SOCIETY OF COSMETIC CHEMISTS kl.I Z 0 5 IO 15 25 35 45 55 65 7 5 95 o Time (t) sec Figure 11. Effect of varying initial sample plug diameter on compliance for petrolatum as calculated with Equation 8. Key: (/•) 1.26 ([•) 1.57 (O) 2.03 cm. Average values, n = 3. 8 ? I I I I i i i i i / i i I •" 2 7 •2 17 22 27 •2 •7 •2 52 62 67 TIME (t) SEC Figure 12. Comparison of compliance curves obtained using Equation 8 (A)and the plastometer Equation 9 (O). The experimental data used are from the original chart recordings for the 0.7-cm high sample (Figure 10).
Purchased for the exclusive use of nofirst nolast (unknown)
From: SCC Media Library & Resource Center (library.scconline.org)