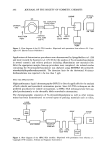
260 JOURNAL OF THE SOCIETY OF COSMETIC CHEMISTS major method of measurement in this field. There have been recent reports (1-12) that a reflectance color meter can be used for the quantitative evaluation of skin erythema. We have evaluated the ability of the Minolta CR-200 Chroma Meter (13) to provide reproducible and quantitative data for determining the degree of erythema caused by mustard (HD) vapor exposure. We used the euthymic hairless guinea pig as a novel animal model. The Chroma Meter used reflected light and read color in a three-dimen- sional format giving the brightness between black and white, the balance between red and green, and the relative amounts of yellow and blue. A preliminary study (14) from our laboratory evaluated the euthymic hairless guinea pig as an animal model for vesicant injury. The results demonstrated that this strain of guinea pig was considerably more sensitive than normal haired guinea pigs to the dermal injury produced by topical application of neat HD. In addition, the lack of hair in this strain greatly simplified the application of a vesicant agent and the subsequent evaluation of the dermal injury produced. This preliminary investigation was conducted in two phases. The first phase evaluated the Chroma Meter's response to small differences between shades of red color using a color chart. The second phase compared the Chroma Meter's response to visual Draize scores of the erythema that developed on the skin of euthymic hairless guinea pig exposed to HD vapor. METHODS A Minolta Chroma Meter model CR-200 (13) was used to make all measurements. This instrument is commercially available and includes a small hand-held measuring head connected to a portable data-processing unit by a flexible cord. The optical system of the measuring head illuminated the sample using diffuse light produced by a pulsed xenon arc lamp with a viewing angle of 0 ø. The area measured was a circle 8 mm in diameter. A total of six silicon photocells were used by a double-beam feedback system to ensure accurate and consistent measurements. Three of the photocells monitored the output of the pulsed xenon arc lamp the other three photocells measured the light reflected by the surface of the sample. The detected signal was converted into three coordinates (L*, a*, and b*) of a three-dimensional color system recommended by CIE (Commission Internationale de I'Eclairage) (15). The coordinate L* represented levels of brightness between white (+ 100) and black (- 100). The a* represented the relative chromaticity between red (+ 60) and green (- 60). The b* coordinate represented the relative amounts of yellow ( + 60) and blue ( - 60). A complete discussion on CIE color systems may be found in the book by Hunt (16). PHASE 1 A color chart was prepared which had 19 zones ranging in color from pale pink to bright red. Five replicate measurements were recorded for each zone and the data ana- lyzed. PHASE 2 The skin of hairless guinea pigs was exposed to HD vapor for either 4 or 8 minutes by a vapor cup exposure technique developed in this laboratory. Guinea pigs were anesthe-

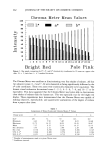
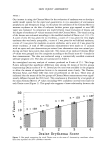
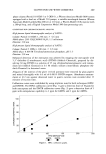
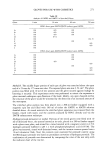
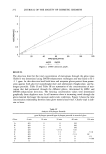
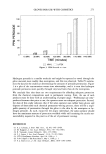
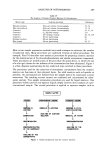
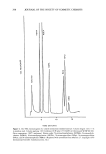
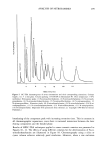
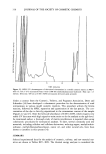
SKIN INJURY ASSESSMENT 261 tized with a combination of ketamine hydrochloride (17) and xylazine (18) administered by intermuscular injection into the lateral thigh and placed in sternal recumbency. Each animal was prepared by attaching six tape assemblies to its back, three on either side of an imaginary line along the dorsal midline of the animal. Tape assemblies were pre- pared by affixing 19-mm squares of double-sided vinyl carpet tape (Devoseal, Devon Tape Corp. Carlstadt, NJ) edge to edge on 1-inch surgical tape (Durapore, Minnesota Mining and Manufacturing Co., St. Paul, MN). A No. 6 corkborer was centered over the removable carpet tape covering and punched through both tapes. The surgical tape was then trimmed to 19-mm width and the free edge attached to a pull tab. After the assemblies were attached to the skin, the protective covering was removed to expose an adhesive surface for fixation of caps. HD vapor challenge was achieved by exposure to HD evaporated within polyethylene caps (No. P799C, Columbia Diagnostics, Inc., Springfield, VA) attached to the tape assemblies. Caps held 14-mm discs of Whatman No. 2 filter paper, fixed 5 mm from the cap rim and wetted with 10 Ixl of HD (USAMRICD Lot No. 2 HD-U42-44-CTF-N-1, 97% pure). This volume of agent was sufficient to uniformly wet the entire surface of the filter paper but not to permit any run-off of liquid agent when the caps were inverted. Loaded caps were stored inverted on glass microscope slides prior to transfer onto animals. Forceps were used to apply caps, remove caps (ending vapor exposure), and to remove tape. The caps were left in place for either 4 or 8 minutes. After removal of the tape the animals were placed in individual cages in a hood. Skin exposed to HD was observed visually and compared to the surrounding normal (non-exposed) skin. At the same time the exposed skin area was also evaluated with the Minolta Chroma Meter. Six replicate Minolta readings were recorded for each exposure site. Evaluations were made at 30, 60, 180, 240, 300, 360, and 1440 (24 hour) minutes post-exposure. After the 24 hour post-exposure observation, the animals were euthanized by anesthetic overdose with halothane. RESULTS AND DISCUSSION PHASE 1 To evaluate the Chroma Meter under ideal conditions, a semi-glossy paper color chart was prepared. The 19 zones on the chart ranged in color from pale pink to bright red. Of the various CIE tristimulus color systems available on the Chroma Meter, we used the L*, a*, b* chromaticity coordinates. This color coordinate system most closely represented human sensitivity to color. An equal distance in this system was approxi- mately an equal difference in perceived color by humans. The results of the Chroma Meter measurements are summarized in the bar graph of Figure 1. This bar graph compared the absolute L*, a*, b* chromaticity coordinates. The L* whiteness coordi- nate was observed to decrease by 32% in going from pale pink to bright red on the color chart. The standard deviation error bars at the top of the bars were too small to be visible. This trend was consistent with the approximate perceived human response. The a* color coordinate was observed to increase by 180%, while the b* color coordinate increased by 270% over the same color interval. Since the a* color coordinate was directly related to the degree of color redness, it was the most appropriate parameter to use for evaluating erythema.
Purchased for the exclusive use of nofirst nolast (unknown)
From: SCC Media Library & Resource Center (library.scconline.org)