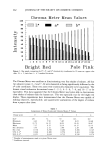
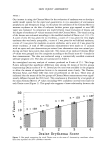
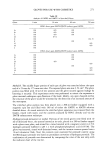
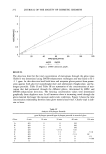
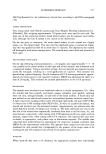
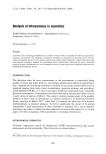
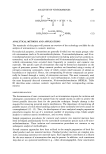
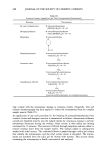
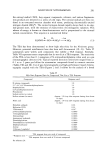
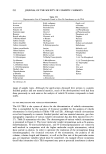
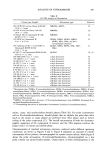
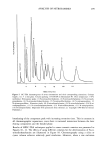
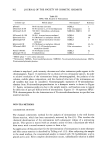
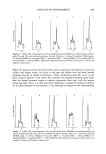
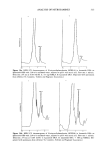
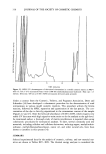
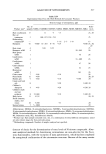
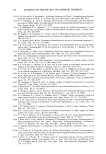
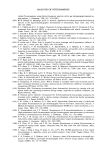
262 JOURNAL OF THE SOCIETY OF COSMETIC CHEMISTS loo Chroma Meter Mean Values ß a* kX%%-'q b* 80 ß 1 g 3 4 5 õ ? 8 9 1O 11 lg 13 14 15 16 17 18 19 Bright Red Pale Pink Figure 1. Bar graph comparing the L*, a*, and b* chromaticity coordinates for 19 zones on a paper color chart. N = 5' error bars = - 1 standard deviation. The Chroma Meter was excellent at discriminating very fine shades of redness. All but two adjacent zones (1-2 and 7-8) were measured as being significantly different by the a* color coordinate. These two zones were statistically measured to be equivalent. The human visual evaluation determined zones 1-2-3, 4-5-6, 7-8, and 16-17 to be equivalent. This data suggested that the Chroma Meter was better able to discriminate close shades of redness than the human eye. This was especially true for the bright red shades. These experiments have demonstrated that the Chroma Meter was capable of making objective, reproducible, and quantitative assessments of the degree of redness from a paper color chart. Table I Comparison of Draize Scores and Chroma Meter a* Values Draize score 0 1 2 3 4 Size a 129. 72. 97. 123. 167. Minimum 4.42 5.50 5.85 8.65 10.68 Maximum 11.75 14.12 19.23 19.45 20.07 Mean 7.37 9.15 12.14 14.17 15.74 Std. deviation 1.54 2.12 2.80 2.28 1.88 Std. error 0.136 0.250 0.284 0.206 0.145 95% C.I. b 0.266 0.489 0.556 0.403 0.284 99% C.I? 0.351 0.644 0.732 0.530 0.374 Number of measurements made at a given Draize score. Confidence interval.

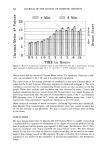
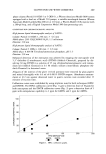
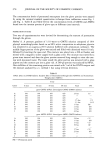
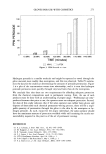
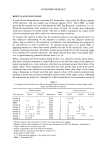
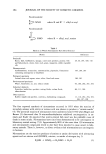
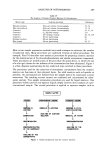
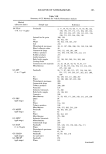
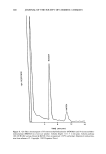
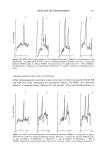
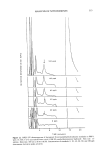
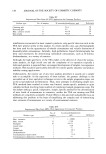
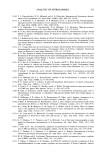
SKIN INJURY ASSESSMENT 263 PHASE 2 Our interest in using the Chroma Meter for the evaluation of erythema was to develop a useful model system for the rapid and quantitative in vivo assessment of antivesicant prophylactic and therapeutic drugs. In this phase the usefulness of the Chroma Meter to measure erythema on the skin of euthymic hairless guinea pigs exposed to neat HD vapor was evaluated. A comparison was made between visual evaluation of lesions and the degree of erythema (a* values) measured with the Chroma Meter. The visual scoring of the lesions was evaluated according to the modified method of Draize et al. (19- 21). A score of zero (0) was given for no erythema, a score of 1 was given for very slight erythema that was barely perceptible, a score of 2 was given for well-defined erythema, a score of 3 was given for moderate-to-severe erythema, and a score of 4 was given for severe erythema. A total of 588 comparison measurements were made on 11 animals with six spots and nine observations per animal (one observation time was missed pro- ducing six fewer data points than expected). The means of six replicate Chroma Meter a* values were grouped into five categories according to the Draize score (0-4) made for that measurement. The data was evaluated using a commercially available statistical software program (22). The data are summarized in Table I. An unweighted one-way analysis of variance produced an F-ratio of 351. This large F-ratio indicated that significant differences exist among the means of the five groups (representing Draize scores of 0-4). Several post hoc tests were available in the program to allow the means of significant factors to be examined more closely. The Duncan, Newman Keul, and Fisher LSD tests were all performed on the data. These tests all indicated that the means of the five groups of Chroma Meter measurements were signif- icantly different beyond the 99% level. This conclusion is illustrated by a bar graph of the mean Chroma Meter's a* values (including 99% confidence interval error bars) for each Draize score (Figure 2). This graph also suggests a linear relationship between the 2O - n= 167 - n= 123 • 15 • r•=97 • 10 - = 5 0 0 1 2 3 4 Draize Erythema Score Figure 2. Bar graph comparing [he visual Draize score [o [he mean a • chromadd[y coordinate values. Error bars represen• •he •% confidence •n•erva[s.
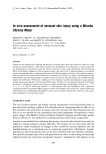
Purchased for the exclusive use of nofirst nolast (unknown)
From: SCC Media Library & Resource Center (library.scconline.org)