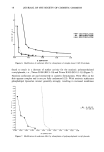
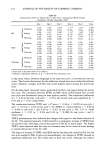
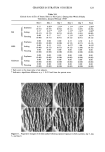
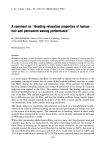
88 JOURNAL OF THE SOCIETY OF COSMETIC CHEMISTS Quantification of adsorbed substances has been demonstrated by application of ra- diotracer techniques (7-8) or by ESCA, i.e., electron spectroscopy for chemical analysis (9). While accurate determination of adsorbed cationic polymer is possible by these latter methods, the techniques are not without difficulty. Radiotracer methodology requires the use of specially synthesized 14C tagged polymers, which may be difficult to obtain. ESCA does not require special types of polymers, but the complexity and limited availability of instrumentation may preclude its routine application. The need for a straightforward method to measure the adsorption of cationic polymer onto hair accurately and routinely has led to an investigation of solution depletion methods of analysis. These methods rely on differences in solution concentration of cationic polymer following immersion of an adsorbing substrate. As such, a concentra- tion difference in cationic polymer before and after immersion is attributed to cationic uptake by the substrate. The colloid titration method has been used to determine charge characteristics of cat- ionic polyelectrolytes (10), as well as the concentration of cationics in solution (11). Quantification of cationic polymer adsorbed onto cellulose fibers (12) and hair (5) via this technique also has limited mention in the literature. The present investigation details procedures needed in using colloid titration for the accurate determination of cationic polymer uptake by hair. EXPERIMENTAL TRESS PREPARATION Medium-dark brown, 8-inch-long, virgin quality European hair (DeMeo Brothers, New York) was mounted on plastic tabs. The mounted hair was washed in a 2.5% ammo- nium lauryl sulfate solution (Stepanol AM, Stepan, Maywood, N J) for 1 minute, rinsed for 1.5 minutes in 40øC running tap water, and air dried thoroughly. Tresses were then bleached (13) in a formulation of 3% hydrogen peroxide (Baker, Phillipsburg, NY). In addition to the normal and recommended bleach time and temperature of 30 minutes at 32øC, much harsher bleaching conditions of 4 hours at 40øC were also used. These samples will be later referred to as "mild" and "harsh" bleach types, respectively. Bleached hair was then soaked overnight in a large volume (8-10 L) of deionized water to thoroughly extract pigment bodies and other substances made soluble by the bleach- ing process. EQUIVALENT WEIGHT DETERMINATION OF CATIONIC POLYMER Solutions containing 0.05, 0.10, and 0.20% (w/v) of cationic hydroxyethylcellulose (HEC) (CTFA designation: Polyquaternium-10, UCARE © Polymer JR 400, Amerchol, Edison, N J) were prepared volumetrically in pH 6.0 - 0.1 buffer prepared from mono- and dibasic sodium phosphate. Standard reagents for the analysis of cationic polymer by the colloid titration method were used. 0-Toluidine blue indicator (Eastman-Kodak, Rochester, NY), 1.00 ml at 4.1 X 10⁻⁴ M, was added to approximately 60 ml of 0.001 M sodium phosphate (pH 6.0) buffer. Aliquots of Polyquaternium-10 solution corresponding to 100-400 I-•g of poly- mer were added to the buffer and indicator solution and titrated by a semi-automated

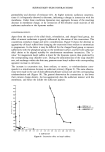
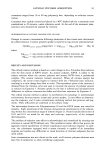
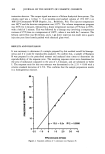
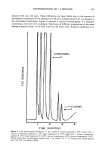
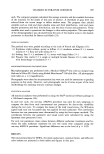
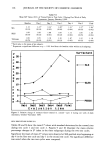
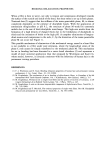
CATIONIC POLYMER ADSORPTION 89 system. A potassium polyvinylsulfate (KPVS) (Eastman-Kodak, Rochester, NY) titrant of known normality (0.52 mN) was dispensed with constant stirring. A 2-ml automatic buret (DVII, Merrier, Highstown, NY), on line with a strip chart recorder (Merrier GA12), was used to introduce the titrant into the system. The change in relative absorbance caused by indicator color change was monitored with a colorimeter (Sybron- Brinkmann, Westbury, NY) equipped with a fiberoptic sensor electrode set at a single wavelength of 620 nm. The titrant was dispensed at a rate of 0.70 ml/minute. A titration curve (Figure 1) was generated on the recorder and the endpoint calculated as the point lying midway between lines drawn tangent to the baselines. The instrumen- tation enabled the added titrant to be read to the nearest 0.025 mi. This precision was crucial to the reproducibility of the method. Plots of Polyquaternium-10 titrated with KPVS are given in Figure 2. The normality of the Polyquaternium-10 solution was calculated from the following relationship: Ncationic polymer (equiv/L) = (NKvvs X VKPvs/Vcationic polymer X slope) [Eq. 1] where slope = slope of regression line (mlKPvS/mlcationic polymer), NKpVS = normality of KPVS titrant (equiv/L), V•pvs = volume KPVS titrated to endpoint (ml), and Vcationic polymer = volume of cationic polymer aliquot (ml). The equivalent weight of the Polyquaternium-10 follows as' Equip Wtcationic polymer (g/equip) = Ccationic polymer/Ncationic polymer where Ccationic polymer ----- cationic polymer solution concentration (g/L). [Eq. 2] E 1.4 • 1.2 LLI 1.0 o z • 0.8 o 03 0.6 LLI 0.4 0.2 0 0.2 0.4 0.6 0.8 1.0 1.2 1.4 1.6 KPVS TITRANT (ml) DENOTES TITRATION ENDPOINT CALCULATED AS MIDPOINT OF DIAGONAL LINE CONNECTING BASELINE TANGENT LINES Figure 1. Sample titration curve obtained in colloid titration analysis. 1.8 2.0
Purchased for the exclusive use of nofirst nolast (unknown)
From: SCC Media Library & Resource Center (library.scconline.org)