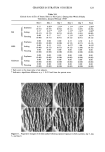
108 JOURNAL OF THE SOCIETY OF COSMETIC CHEMISTS INFRARED (IR) SPECTROSCOPIC MEASUREMENTS Attenuated total reflectance (ATR) Fourier transform infrared (FTIR) spectroscopic measurements were performed with a Perkin-Elmer Model 1600 FTIR spectrophotom- eter (Perkin-Elmer Corporation, Norwalk, CT) with a side focus horizontal attachment and an internal reflection element (IRE) of zinc selenide (Harrick Scientific Corporation, Ossining, NY). The patched skin site was placed directly on the IRE. The applied pressure corresponded to the weight of the forearm, and was adjusted (if necessary) based on the reading of the intensity of the incident light through the prism. The amide I band (approximately 1,645 cm-•) and the amide II band (approximately 1,545 cm-•) were used to determine skin moisture. While the amide II band is only minimally altered by the presence of water, the amide I band is greatly affected. The absorption ratio of amide I to amide II bands was calculated and will be referred to as the moisture factor (MF). A detailed description of this technique was published by Puttnam (23). SKIN REFLECTIVE COLOR MEASUREMENTS Skin color and reflectance measurements were performed with a Minolta Chroma Meter ©, Model CR-200 (Minolta Camera Co., Ltd., Osaka, Japan). Absolute measure- ments were taken in L*a*b* (CIE 1976) system. The L* values indicated the brightness of the skin being analyzed, and the positive a* values (+ a*) the erythema of the skin surface. Bubulak et al. (24) described in detail the methodology of this measurement technique. ANALYSIS OF SKIN REPLICAS Negative skin replicas of each subject's test sites were made with Silflo © quick-drying silicone rubber (Flexico Developments Ltd, Potters Bar, England). For capturing the image onto a videodisc, a Zeiss OMP-1 Stereo operating microscope (Carl Zeiss, Inc., Thornwood, NY), a special Dage-MTI CCD-72 video camera (Dage-MTI, Inc., Mich- igan City, IN), and a Targa-M8 © frame grabber (Truevision, Inc., Indianapolis, IN) were used. Care was taken to preserve the orientation of the replicas with respect to the actual forearm skin to allow for accurate interpretation of day-to-day changes. The skin replica was taped onto a metal cassette, which was placed in a custom-made light-tight box to prevent stray light from striking the replica. The intensity of the light sources was strictly controlled by a highly regulated power supply. Fiberoptic light pipes were used to provide even illumination at an angle set at 20 ø incidence. Two images were captured from each replica by using two incident light sources set at right angles to each other. The image was visualized on a video monitor, and selected fields were stored on video floppy discs using a Canon Still Video Recorder (Canon, Inc., Tokyo, Japan). A 386-based microcomputer was used in conjunction with JAVA © video analysis software (Jandel Scientific, Corte Madera, CA) for all image processing, analysis, and control functions. The process for image analysis can be briefly summarized as follows: First, a 12-mm x 12-mm area from the middle of each image was defined as the area for analysis. The defined area was then divided into 512 x 512 pixels of 256 gray levels

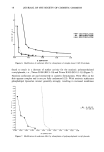
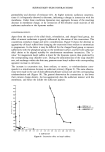
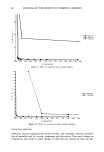
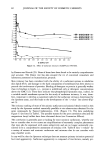
CHANGES IN STRATUM CORNEUM 109 each. The computer program calculated the average intensity and the standard deviation of the intensity for the pixels of this area of interest. A threshold of gray level was selected from the screen image to define shadow areas. The program then yielded variables such as total and mean shadow areas and their distribution, total and mean shadow perimeters and their distribution, and the ratio of areas and perimeters. These variables were used to quantitate the changes in skin surface properties. The mean depth of the dermatoglyphics was calculated from the ratio of the shadow areas to the shadow perimeters as described by Barton and Black (25). CLINICAL GRADINGS The patched sites were graded according to the scale of Frosch and Kligman (11): (i) Erythema: slight redness, spotty or diffuse (1 q-) moderate redness (2 q- ) intense redness (3 q- ) fiery red with edema (4 q- ) (ii) Scaling: fine (1 q- ) moderate (2 q-) severe with large flakes (3 q-) (iii) Fissures: fine cracks (1 q- ) single or multiple broader fissures (2 q- ) wide cracks with hemorrhage or exudation (3 q- ) MACROPHOTOGRAPHIC DOCUMENTATION Macrophotography was performed with a Medical Nikkor © lens with an integral ring flash and a Nikon FE-2 body using Kodak Ektachrome © 100 slide film. All photographs were taken at a 1:2 magnification. Photographs were taken for documentation but were not used for assessment or grading purposes in this study. However, such photographs can be of value as part of the total methodology for assessing stratum corneum changes. STATISTICAL ANALYSIS All statistical analyses were performed by using the SAS © statistical software package in a 386-based computer (26). In each test cycle, the one-way ANOVA procedure was used for each subgroup to compare the data from each instrumental test parameter for day-to-day variability during the test cycle. To compare the means of the total visual scores, the Wilcoxon signed rank sum test for paired data was applied for each surfactant. The correlations between two test parameters were determined by using the least square methods. The correlations between test parameter and visual scores were calculated by using the Spearman (non-parametric) tests. For each test parameter, mean values between different surfactant treatments and be- tween the same surfactant treatment for two test cycles were compared using the one-way ANOVA procedure. Significant difference was at the level of p = 0.05. RESULTS The instrumental data for TEWL, electrical conductance, moisture factor, and reflective color indexes are presented in both tables and figures in this part.
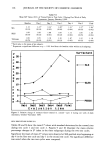
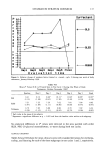
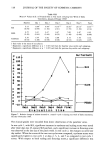
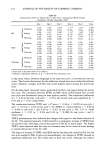
Purchased for the exclusive use of nofirst nolast (unknown)
From: SCC Media Library & Resource Center (library.scconline.org)