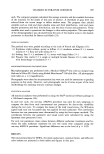
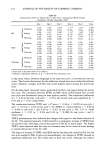
110 JOURNAL OF THE SOCIETY OF COSMETIC CHEMISTS The tables present day-by-day mean values with standard deviations (S.D.) for each instrumental parameter. The figures present the data as the mean relative percentage changes. Both treated and control site values obtained at any day during the test period plus the corresponding initial baseline values were taken into consideration to arrive at a single number of the relative percentage change for each subject, as follows: (% P)n = [(Pt/Pc)n - (Pt/P½)o]*100 where p z Pt --- (% P)n = (Pt/Pc)n = (Pt/Pc)o = any instrumental parameter (i.e., TEWL, electrical conductance, MF, a* and L*) the value from treated site the value from control site the day during a test cycle, n = 1-5, and 8 (final day for evaluation) the relative percentage change of P at day n the ratio of the values between treated and control sites at day n and the ratio of the baseline values between treated and control sites. Statistical significance is indicated in each table by superscript numbers, with 1 being significant at p = 0.05 level from the initial pretest baseline value, and 2 indicating significance at p = 0.05 level from the previous day's value. TRANSEPIDERMAL WATER LOSS (TEWL) MEASUREMENTS Tables I and II show the mean TEWL values for three subgroups in test cycles 1 and 2. The unit of TEWL values in g/m2/hr. Figures 1 and 2 show the relative changes observed during these two test periods. In test cycle 1, both SLS and SLES caused significant increases in TEWL values starting at day 1 after two 45-minute surfactant exposures. TEWL values at patched sites treated with these two surfactants showed steady increases during subsequent treatment days, although the degree of increase caused by SLES was far less than that caused by SLS. By days 4 and 5, after eight and ten 45-minute SLS patches, respectively, the sites patched with SLS showed dramatic increases in TEWL. A significant increase in TEWL occurred Table I Mean TEWL Values (S.D.) of Treated Sites in Test Cycle 1 During One Week of Daily Treatments, October-November 1989' Baseline Day 1 Day 2 Day 3 Day 4 Day 5 Final 3.0 5.2 • 5.5 • 7.6 • 17.0 •'2 32.5 •'2 10.3 •'2 SLS (0.4) (0.1) (0.5) (1.1) (5.4) (9.8) (1.8) 4.1 6.1 • 6.0 • 7.1 • 8.0 • 12.0 •'2 7.0 •'2 SLES (0.6) (0.9) (1.0) (1.2) (1.4) (1.9) (2.3) 4.5 5.2 4.6 4.7 4.6 5.0 4.4 Tallowate (0.8) (0.7) (0.4) (0.7) (0.9) (0.6) (0.5) * Each value is the mean of six subjects unit of measurement is g/m2/hr. • Represents a significant difference at p = 0.05 level from the baseline value within each subgroup. 2 Represents a significant difference at p = 0.05 level from the previous day within each subgroup.

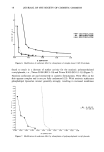
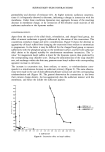
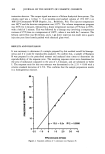
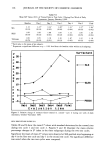
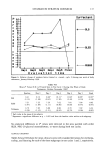
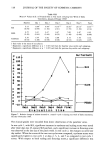
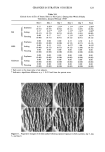
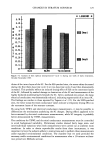
CHANGES IN STRATUM CORNEUM 111 Table II Mean TEWL Values (S.D.) of Treated Sites in Test Cycle 2 During One Week of Daily Treatments, January-February 1990' Baseline Day 1 Day 2 Day 3 Day 4 Day 5 Final 3.6 7.3 • 12.8 L2 37.7 •'2 51.7 ]'2 49.7 • 11.9 •'2 SIS (0.4) (0.6) (2.7) (10.4) (7.7) (5.7) (2.9) 4.5 5.1 6.7 • 9.7 • 10.9 ] 12.2 • 8.2 • SLES (0.9) (1.1) (1.1) (1.4) (1.0) (1.6) (1.4) 4.1 4.5 4.8 5.3 5.2 5.3 4.2 Tallowate (0.3) (0.8) (0.9) (0.6) (L0) (1.3) (0.9) * Each value is the mean of six subjects unit of measurement is g/m2/hr. • Represents a significant difference at p = 0.05 level from the baseline value within each subgroup. 2 Represents a significant difference at p = 0.05 level from the previous day within each subgroup. P 500-- Supfactant e p 450-- c 400-- e c SLS n 350-. t 3oo-- g ::,50-- e 200-- : SLES c •50-- h •,00-- õ0-- • ._..x,.---.--,x------• n e'•._.....,x___x....• g o • • • •-+"•• • PEG20 E! -50- Day • Day 2 Day3 Day4 Day5 Ftna:l Evaluation time Figure 1. Relative change of TEWL (treated vs. control---cycle 1) during one week of daily treatments, October-November 1989. between day 4 and day 5 with SLES, but was less than the mean SLS value on day 4. Mean TEWL values of the patched sites treated with SLS and SLES significantly de- creased at the final measurement taken after two days of rest. The patched sites treated with PEG-20 glyceryl monotallowate showed no significant changes in the mean values. No significant changes in TEWL were found on the control water-treated sites of all three subgroups during the entire test cycle. Figure 1, which shows the relative percentage changes in TEWL, clearly shows the
Purchased for the exclusive use of nofirst nolast (unknown)
From: SCC Media Library & Resource Center (library.scconline.org)