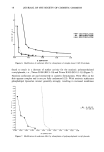
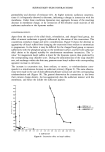
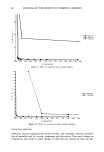
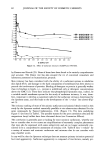
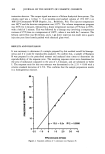
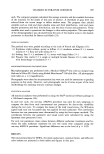
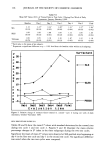
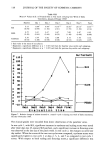
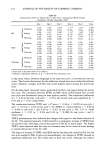
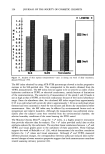
122 JOURNAL OF THE SOCIETY OF COSMETIC CHEMISTS Table XI Clinical Scores (S.D.) of Treated Sites in Test Cycle 1 During One Week of Daily Treatments, October-November 19897 Day 1 Day 2 Day 3 Day 4 Day 5 Final 0.00 0.00 0.83* 2.17' 2.67* 2.00* Erythema (0.00) (0.00) (0.45) (0.98) (1.03)2.50*0.17(0.55)(0.41)1.83*0.67' (0.8 SLS Scaling 0.00 0.33 0.83* 1.33* (0.00) (0.52) (0.41) (0.52) (0.41) Fissuring 0.00 0.00 0.00 0.33 (0.00) (0.00) (0.00) (0.52) (0.52) 0.00 0.00 0.00 0.00 0.00 0.00 Erythema (0.00) (0.00) (0.00) (0.00) (0.00)0.500.00(0.55)(0.00)0.170.00(0.00) (0.0 SLES Scaling 0.00 0.00 0.17 0.50 (0.00) (0.00) (0.41) (0.55) (0.41) 0.00 0.00 0.00 0.00 Fissuring (0.00) (0.00) (0.00) (0.00) 0.00 0.00 0.00 0.00 0.00 0.00 Erythema (0.00) (0.00) (0.00) (0.00) (0.00)0.000.00(0.00)(0.00)0.000.00(0.00)(0.00) (0.0 0.00 0.00 0.00 0.00 Tallowate Scaling (0.00) (0.00) (0.00) (0.00) 0.00 0.00 0.00 0.00 Fissuring (0.00) (0.00) (0.00) (0.00) ? Each score is the mean value of six subjects. * Indicates a significant difference at p = 0.05 level from the pretest score. to-day mean values, between subgroups in the same test cycle, or between the two test cycles. The clinical observations for the surfactant-treated sites were similar for both test cycles. However, changes with SLS were noted slightly earlier during the winter test cycle. On the other hand, measured values, particularly for SLS, were larger during the winter test cycle. The correlation between TEWL and MF values of SLS-treated sites in both test cycles was determined using the least squares method. The correlation coefficients ofr = 0.69 in the first cycle and r = 0.78 in the second cycle were significant (p = 0.03 and p = 0.02, respectively). The correlations between TEWL and +a* were r = 0.96 (p = 0.005) in test cycle 1 and r = 0.91 (p = 0.01) in test cycle 2. For TEWL vs. visual erythema, r = 0.86 (p = 0.04) in test cycle 1 and 0.90 (p = 0.01) in test cycle 2. For +a* vs. visual erythema, r = 0.92 (p = 0.03) and 0.94 (p = 0.008) for test cycles 1 and 2, respectively. TEWL measurements best indicated the changes with regard to the barrier function of the SC. The repeated exposures to SLS resulted in a progressive increase of TEWL from the patched sites, reflecting a loss of the capacity of the SC to retain water. The higher TEWL values observed after four days of treatments may be the result of severe damage or partial destruction of the SC itself. The degree of increase of TEWL with SLES was far less than that caused by SLS. For the test sites treated by PEG-20 glyceryl monotallowate, the changes in TEWL showed no significant differences over the control sites in both test cycles. Although the relative

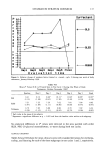
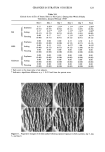
CHANGES IN STRATUM CORNEUM 123 Clinical Scores (S.D.) Table XII of Treated Sites in Test Cycle 2 During One Week of Daily Treatments, January-February 19901 Day 1 Day 2 Day 3 Day 4 Day 5 Final Erythema 0.17 0.83* 2.33* 3.17' 2.67* 2.0 (0.41) (0.45) (0.82) (0.41) (1.03) (0.89) SLS Scaling 0.17 0.67* 1.33* 2.33* 2.67* 3.00' (0.41) (0.52) (0.52) (0.82) (1.03) (0.00) Fissuring 0.00 0.17 0.17 1.33* 1.83' 0.67* (0.00) (0.41) (0.41) (0.52) (0.41) (0.52) 0.00 0.00 0.00 0.33 0.50 0.17 Erythema (0.00) (0.00) (0.00) (0.52) (0.55)0.83*0.00(0.45)(0.00)1.000.00 (0.4 SLES Scaling 0.00 0.33 0.33 0.67* (0.00) (0.52) (0.52) (0.52) (1.09) Fissuring 0.00 0.00 0.00 0.00 (0.00) (0.00) (0.00) (0.00) (0.00) 0.00 0.00 0.00 0.00 0.00 0.00 Erythema (0.00) (0.00) (0.00) (0.00) (0.00)0.000.00(0.00)(0.00)0.000.00(0.00) (0.0 Tallowate Scaling 0.00 0.00 0.00 0.00 (0.00) (0.00) (0.00) (0.00) (0.00) Fissuring 0.00 0.00 0.00 0.00 (0.00) (0.00) (0.00) (0.00) i Each score is the mean value of six subjects. * Indicates a significant difference at p = 0.05 level from the pretest score. Figure 11. Progressive changes of the skin surface following repeated exposure to S• at prctcst, day 3, day 5, and day 8.
Purchased for the exclusive use of nofirst nolast (unknown)
From: SCC Media Library & Resource Center (library.scconline.org)