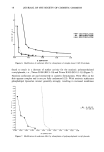
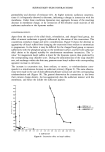
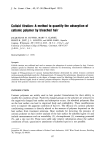
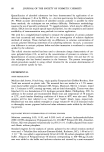
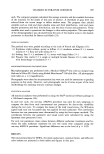
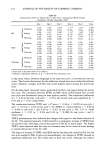
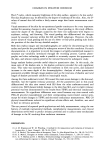
SURF. ACTANT-SKIN INTERACTIONS 73 labtAKE L Figure 1. Liposome preparation by petroleum ether evaporation. injected simultaneously into the two glass chambers that contained 4 ml each of the trapping solution at 60øC. The injection rate was controlled by an injection pump (Sage Instruments) to approximately 0.2 ml/min. Liposomes thus produced were always used within three days. Aliquots for each day's work were separated at this point and refrigerated. TRAPPING SOLUTION-ENCAPSULATION OF FLUORESCENT DYE IN INTERIOR OF INTACT LIPOSOMES (FIGURE 2) The trapping solution was prepared to contain 0.01 M 5(6)-carboxyfluorescein in 0.05 M Tris buffer at pH 7.4. Carboxyfluorescein fluorescence is quenched at higher con- centrations. Thus, leakage, i.e., dilution of the dye, is measured as increase in fluores- cence intensity. pH and temperature also affect the fluorescence readings. It is therefore essential to standardize osmolality (to prevent dilution of the dye caused by water movement into or out of the liposomes), pH, and temperature, so that membrane stability relates directly to the surfactant concentrations in the respective test solutions. Thus, the osmolality of not only the trapping solution, but also of every other solution coming into contact with the liposomes was adjusted to 290 mOsm/kgH20 with NaCI. The osmolality was measured with a Wide Range Osmometer (Advanced Instruments, Inc., Needham Heights, Mass.). Test solutions (4 ml) were pre-heated to 37øC, and a temperature-stabilized sample cell holder in a Perkin Elmer 650S fluores- cence detector was used for the fluorescence determinations. The excitation and emission wavelengths were 492 nm and 520 nm, respectively. Prior to use the external trapping solution was removed by gel chromatography (Seph- adex G-25). 60-Drop aliquots were collected, and the first and last fractions containing liposomes were discarded to assure an even size distribution.

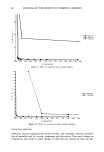
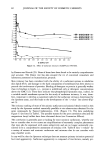
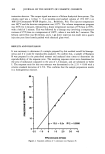
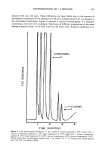
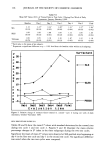
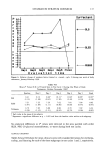
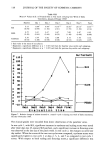
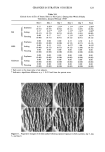
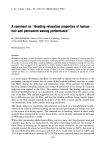
74 JOURNAL OF THE SOCIETY OF COSMETIC CHEMISTS Figure 2. Set-up for fluorescence measurement and computer monitoring. Determination of organic phosphate. The surfactant interacts with the phospholipid in a direct molar ratio. To standardize the phospholipid aliquot the organic phosphate concentration of the liposomes was determined by the method of Stewart (18). Liposome working aliquots were calculated so that the final concentration in the test solution was 0.05 mM phospholipid. Monitoring the release of carboxyfluorescein from liposomes. Maximal potential fluorescence (100%) was determined by destroying a working aliquot of liposomes in a 10-mM solution of taurodeoxycholate. For the 0% value, the fluorescence intensity of a liposome working aliquot in isotonic 0.05-M Tris buffer was established. Leakage of marker from liposomes in buffer was negligible over the course of several hours. In a method previ- ously developed for the study of bile acids (19), a constant amount of liposomes (see above) was added to an isotonic test solution containing surfactant, so that the final volume was 4 ml. After mixing, solutions were quickly transferred to Ultra-Vu poly- propylene disposable cuvettes (American Scientific Products) and placed into the fluo- rimeter that was interfaced with an IBM personal computer. A computer program was developed that recorded fluorescence values at regular time intervals and also the time (in minutes) at which 50% of the maximal fluorescence was read. This point was identified as t«. The readings can, however, be recorded quite easily with a stopwatch. Interpretation of d•ta. The effect of each surfactant on the liposomal membranes was determined over a wide concentration range. For each concentration the t« value was established. Plots of t V2 vs surfactant concentration yield curves that are indicative of the way in which each surfactant interacts with the liposomal membranes. (Figures 4-12). As the surfactant monomer concentration increases, the t« value decreases. In the region of the CMC, the monomer concentration stabilizes and with it the t« value. The CMC, therefore, can be recognized as the "bend" in the curve. It is well known that the individual surfactant molecules are the irritancy-producing
Purchased for the exclusive use of nofirst nolast (unknown)
From: SCC Media Library & Resource Center (library.scconline.org)