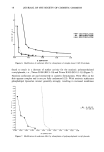
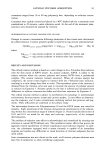
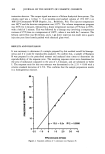
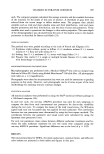
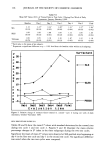
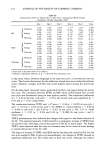
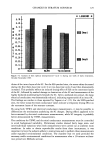
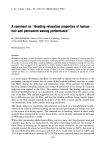
118 JOURNAL OF THE SOCIETY OF COSMETIC CHEMISTS Table VIII Mean a* Values (S.D.) of Treated Sites in Test Cycle 2 During One Week of Daily Treatments, January-February 19907 Baseline Day 1 Day 2 Day 3 Day 4 Day 5 Final 6.53 8.00 • 8.99 • 14.36 •'2 16.69 • 20.13 • 13.43 •'2 SLS (0.84) (0.90) (1.04) (2.41) (1.55) (1.96) (2.14) 6.25 6.41 6.47 6.67 7.00 6.87 6.43 SLES (0.49) (0.64) (0.46) (0.39) (1.48) (0.60) (0.88) Tallowate 6.39 6.44 6.02 6.08 6.14 5.94 6.14 (0.93) (1.08) (0.58) (0.48) (0.93) (0.49) (1.07) Each value is the mean of six subjects. Represents a significant difference at p = 0.05 level from the baseline value within each subgroup. Represents a significant difference at p = 0.05 level from the previous day within each subgroup. Surfac[an[ it0-- //• ioo-- 90-- o SLS 80-- 70-- 60-- 50-- 40 - - x SLES 30-- 20-- -iO .- Day! Day:= Day3 Oey4 Oey5 Fine[ Eva[ua•:'lon •: 'lm e i Figure 7. Relative change of redness (treated vs. control-•cycle 1) during one week of daily treatments, October-November 1989. The clinical grades were recorded from direct observation of the panelists' arms. In test cycle 1, with SLS, significant increases in erythema and scaling scores were noted after three days (six 45-minute SLS patches), and a significant increase in fissuring score was observed at the last day of the patch week. In test cycle 2, the changes occurred one day earlier. When the scores of the two test cycles were compared, erythema scores were significantly higher in test cycle 2 at days 2, 3, 4, and 5 as compared to test cycle 1 scores. With respect to both scaling and fissuring scores,a significant difference was

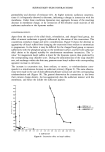
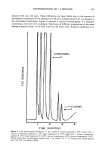
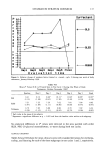
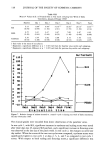
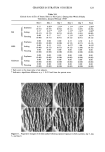
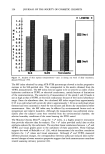
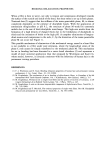
CHANGES IN STRATUM CORNEUM 119 p ieO-- Surfactant e i70 r t60 c i50 t40 o SLS e n i20 t •o a g 9o e 80 x SLES 7O c 6O h 5O a 4O n 3o 20 g iO • PEG20 e 0 Day]. Day: = Day3 Day4 Day5 Fina! Evaluation time Figure 8. Relative change of redness (treated vs. control--cycle 2) during one week of daily treatments, January-February 1990. Table IX Mean L* Values (S.D.) of Treated Sites in Test Cycle 1 During One Week of Daily Treatments, October-November 19897 Baseline Day 1 Day 2 Day 3 Day 4 Day 5 Final 64.85 64.59 64.74 64.47 61.18 59.82 59.19 SLS (1.44) (1.03) (1.12) (1.84) (2.01) (1.22) (2.03) 63.20 62.92 63.14 62.41 63.15 63.12 63.29 SLES (1.96) (2.13) (1.78) (0.99) (1.58) (1.64) (1.45) 64.06 64.45 63.81 64.03 64.16 64.28 63.64 Tallowate (1.23) (1.75) (1.50) (1.34) (1.58) (1.38) (1.88) Each value is the mean of six subjects. Represents a significant difference at p = 0.05 level from the baseline value within each subgroup. noted at days 4 and 5. With SLES, a minimal scaling condition developed in some of the subjects after two to four days in test cycle 1, but the results were not statistically significant. During test cycle 2, the mean scaling scores showed significant increases at days 4, 5, and 8. No statistically significant changes were noted with respect to erythema or fissuring in either test cycle. No visible changes were detected on any sites patched with either PEG-20 glyceryl monotallowate or water.
Purchased for the exclusive use of nofirst nolast (unknown)
From: SCC Media Library & Resource Center (library.scconline.org)