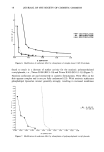
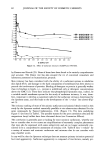
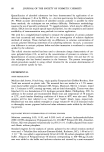
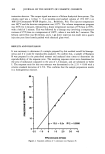
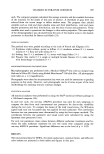
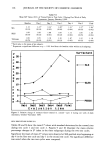
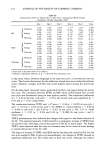
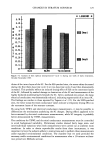
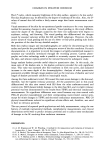
116 JOURNAL OF THE SOCIETY OF COSMETIC CHEMISTS Table VI Mean MF Values (S.D.) of Treated Sites in Test Cycle 2 During One Week of Daily Treatments, January-February 1990' Baseline Day 1 Day 2 Day 3 Day 4 Day 5 Final 1.13 1.22 • 1.24 • 1.26 • 1.31 • 1.37 • 1.04 • SLS (0.03) (0.04) (0.05) (0.06) (0.04) (0.05) (0.02) 1.08 1.08 1.08 1.09 1.11 1.09 1.09 SLES (0.03) (0.02) (0.02) (0.02) (0.04) (0.05) (0.04) 1.08 1.05 1.10 1.10 1.07 1.12 1.10 Tallowate (0.05) (0.03) (0.03) (0.03) (0.02) (0.02) (0.06) * Each value is the mean of six subjects. 1 Represents a significant difference at p = 0.05 level from the baseline value within each subgroup. p Supfactant e 35-- P c 3o-- o SLS e •5-- n i: 2o-- g t5-- t0 -- e---- • :SLES c h 5' n o g e -5 - - i PEI•20 Dayt Day2 Day3 Day4 Day5 Final Evaluat:lon time Figure 5. Relative change of moisture factor (treated vs. control-•cycle 1) during one week of daily treatments, October-November 1989. SKIN BRIGHTNESS INDEX (L*) Tables IX and X show the mean L* values with standard deviations for the treated sites during test cycle ! and test cycle 2. Figures 9 and 10 illustrate the mean relative percentage changes in L* index in the three subgroups during the two test cycles. Significant decreases of mean L* values were observed at SLS-patched sites beginning at day 4 in the first test cycle and day 3 in the second test cycle. No significant difference was noted when the two test cycles were compared.

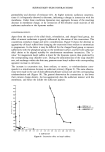
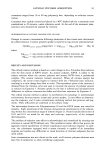
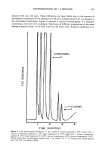
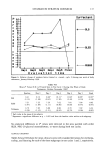
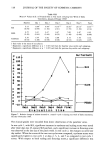
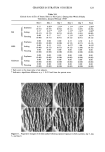
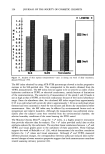
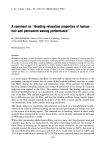
CHANGES IN STRATUM CORNEUM 117 Figure 6. Relative change of moisture factor (treated vs. control-•cycle 2) during one week of daily treatments, January-February 1990. Table VII Mean a* Values (S.D.) of Treated Sites in Test Cycle 1 During One Week of Daily Treatments, October-November 1989• Baseline Day 1 Day 2 Day 3 Day 4 Day 5 Final 6.41 8.12 8.66 • 10.31 • 13.84 • 16.85 • 10.95 • SLS (1.12) (1.08) (0.45) (1.50) (2.42) (3.10) (1.38) 7.21 7.22 7.29 7.62 7.81 7.99 8.02 SLES (1.07) (1.09) (1.11) (0.86) (0.60) (0.54) (0.45) 6.79 7.03 6.88 6.88 6.70 7.02 6.34 Tallowate (1.20) (1.32) (1.21) (0.82) (0.79) (1.06) (0.85) Each value is the mean of six subjects. Represents a significant difference at p -- 0.05 level from the baseline value within each subgroup. No statistical differences in L* values were detected in the sites patched with either SLES, PEG-20 glyceryl monotallowate, or water during both test cycles. CLINICAL GRADINGS Tables XI and XII show the mean clinical scores with standard deviations for erythema, scaling, and fissuring for each of the three subgroups in test cycles ! and 2, respectively.
Purchased for the exclusive use of nofirst nolast (unknown)
From: SCC Media Library & Resource Center (library.scconline.org)