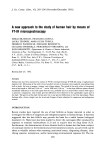
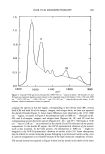
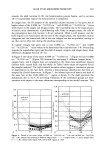
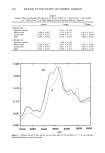
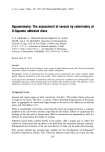
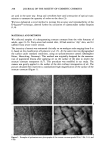
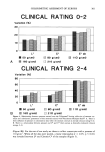
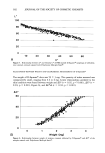
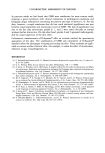
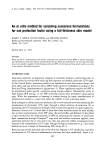
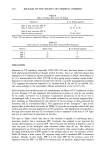
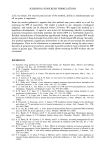
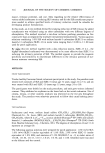
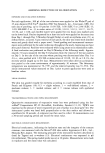
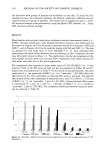
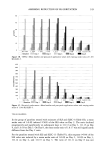
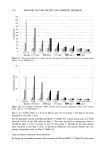
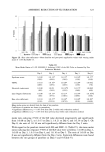
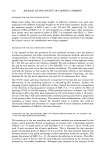
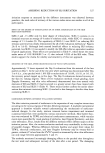
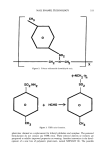
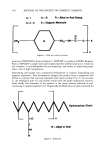
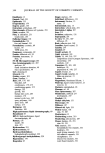
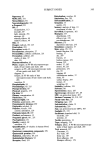
COLORIMETRIC ASSESSMENT OF XEROSIS 301 CLINICAL RATING 0-2 Variation (%) 30 A 20 10 0 L* C* I•1 50 g/cm2 • 80 g/cm2 I• I• 160 g/cm2 • 210 g/cm2 E* ab 110 g/cm2 CLINICAL RATING 2-4 Variation (%) 80 6O 4O 2O L* C* E* ab I•1 50 g/cm2 • 80 g/cm2 I•1 110 g/cm2 B 160 g/cm2 :• 210 g/cm2 Figure 4. Relationship between pressure exerted onto the D-Squame © during collection of stratum cor- neum and colorimetric parameters of this material stained with Polychrome Multiple Stain ©. A. There is little influence of pressure on colorimetric data when the stratum corneum is normal (clinical rating 0-2). B. There is a relationship between pressure and L* and C* when xerosis is clinically evidenced (clinical ratings 2-4). (Figure 4B). For the rest of our study we chose to collect corneocytes with a pressure of 110 g/cm 2. When all the data were pooled, a linear relationship (r = 0.95, p 0.01) was revealed between L* and Chroma C* of the samples (Figure 5).

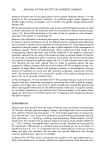
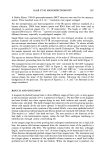
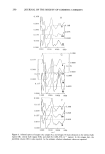
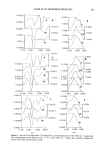
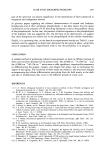
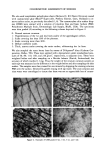
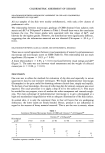
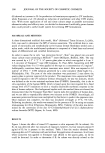
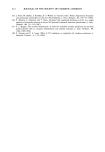
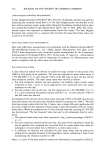
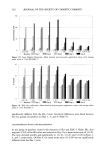
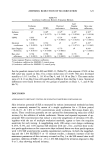
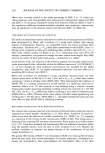
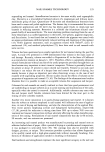
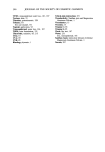
302 JOURNAL OF THE SOCIETY OF COSMETIC CHEMISTS :• 100 40 ß 2O 10 20 30 40 50 60 A c* Figure 5. Relationship between L* and Chroma C* of PMS-stained D-Squame © samplings of orthokera- totic stratum corneum stained with Polychrome Multiple Stain ©. RELATIONSHIP BETWEEN WEIGHT AND COLORIMETRIC MEASUREMENT OF D-SQUAME © The weight of D-Squame © discs was 59 - 3 mg. The quantity of scales removed was comparatively small, ranging from 0.6 to 4 mg. Linear relationships unrelated to the skin condition were found between weight and AL* (r = 0.92, p 0.001), AC* (r = 0.94, p 0.001, Figure 6), and AE*ab (r = 0.94, p 0.001). AC* 60 4O 2O e © •l•el• ß e•e B 0 I 2 3 4 Weight (mg) Figure 6. Relationship between weight of stratum corneum collected by D-Squame © and AC* of the samples stained with Polychrome Multiple Stain ©.
Purchased for the exclusive use of nofirst nolast (unknown)
From: SCC Media Library & Resource Center (library.scconline.org)