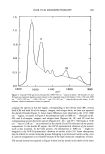
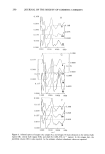
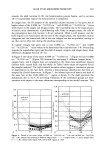
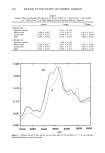
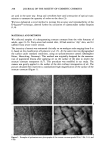
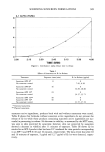
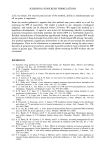
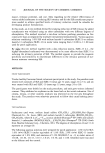
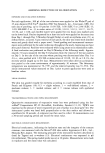
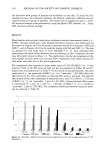
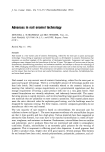
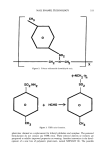
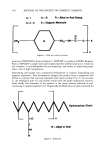
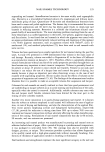
HAIR FT-IR MICROSPECTROSCOPY 287 A Perkin Elmer 1760-X spectrophotometer (MCT detector) was used for the measure- ments. Three hundred scans of 4 cm-• resolution were signal averaged. For the interpretation and band assignment of the IR spectra reference standard of a human albumin, DNA from salmon sperm and RNA from calf liver were used as --1 illustrated in previous papers (16, 17, 18 respectively). The bands at 1080 cm (mainly DNA) and at 1540 cm- • (protein) are particularly interesting since they show different features, especially in pathological samples (14). Single fibers were examined by pressing them into two diamond windows of a high- pressure diamond cell suitable for FT-IR microspectroscopy. Unlike other techniques, the microscope attachment allows the analysis of individual fibers. To obtain reliable spectra, the samples had to be suitably pressed in order to obtain optical density values as low as possible (0.7-0.9), especially for the Amide II absorption. The morphology of the sample squeezed into the high pressure diamond cell was sufficiently well main- tained, as the various regions of the hairs were found to be well defined. The spectra on thirteen-fifteen microdomaines, of the order of 100 microns in diameter, were obtained, proceeding from the bulb matrix to the shaft (for each bulb) (Figure 1). The integrated areas were calculated using the "area" command for the CDS 3-program of Perkin-Elmer computer model 7300. In Figure 2, the typical spectrum of hair is reported. Integrated areas of the bands at 1540, 1238, and 1080 cm-• were calculated for each spectrum on the basis of 1595-1475 cm-• 1300-1185 cm-• and 1137-997 --1 cm baseline points respectively, considering that in all spectra corresponding to the various phases the slope of the baselines were similar, following the trend of the background of the spectrum. The spectra of Figures 2, 3, 4, and 7 are flattened in the range considered. RESULTS AND DISCUSSION A diagram of plucked human hairs in three different stages of their cycle, as they appear at the microscopic analysis (15 X), is presented in Figure 2. The hair fiber in the diagram has been divided into three regions along its axis: bulb (inferior and central), supra- bulbar zone, and shaft. The bulb of anagen hair (matrix) is the actively growing portion, whose cells rapidly divide and move upward. It should be remembered that a plucked hair usually represents only a portion of the normal follicle, since some epithelial and all derreal components (dermal papilla and fibrous sheath) are normally left behind (19,20). This results in a "naked" hair shaft and root. The next portion in the direction of the hair shaft is the keratinization region, where the hair fiber undergoes hardening or solidification through cystine cross-linking (6). In the catagen stage the actively growing hair undergoes transformation into a dead club hair the matrix cells become separated from the connective tissue of the papilla by a column of epithelial cells (EC). The epithelial column below the club hair, although fragile, may be extracted as a clear "tail" of tissue clinging to the keratinized club (21). These features distinguish plucked catagen hairs from anagen hairs. The lowermost end of the disconnected hair shaft (hair club) becomes fully keratinized. At the beginning of the telogen phase, a remnant of the epithelial column remains as a small bud (called epithelial sac) off the base of the hair follicle. When the telogen hair is plucked, the

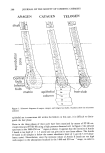
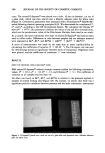
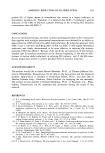
288 JOURNAL OF THE SOCIETY OF COSMETIC CHEMISTS ANAGEN CATAGEN TELOGEN c• o • N Central bulb :•,•-_- - • Inferiof•.:•- :_ ?i• _--..--_-• IJ[J-Ib "--• matrix epithelial column hair club Figure 1. Schematic diagrams of anagen, catagen, and telogen hair bulbs. Numbers show the microareas analyzed. epithelial sac is sometimes left within the follicle in this case, it is difficult to distin- guish the hair phase. Hairs in the three phases of their cycle have been examined by means of FT-IR mi- crospectroscopy (FT-IR-M) using a high pressure diamond cell. In Figure 2 the infrared spectrum in the 1800-950 cm- 1 region is shown. It appears that the intensity of Amide I bands is too high (A = 1.5 units) and can give rise to non-linear effects. The Amide II bands in all samples is below the correct absorbance limit of 1 unit (0.7-0.9 absor- bance units). Nevertheless, since the intensity values of Amide II bands are too high --1 with respect to the absorptions localized in the 1480 and 950 cm range, in order to
Purchased for the exclusive use of nofirst nolast (unknown)
From: SCC Media Library & Resource Center (library.scconline.org)