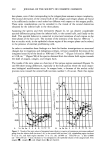
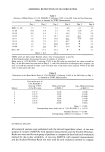
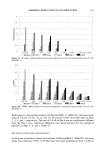
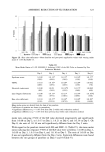
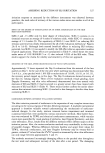
324 JOURNAL OF THE SOCIETY OF COSMETIC CHEMISTS Table IV Mean Molar Ratios of 1.0% SLS:SLEC-13 Inducing •50% of SLS Value as Assessed by Five Evaluation Methods Day 2 Day 3 Day 4 Day 5 Day 8 Erythema scores TEWL Electrical conductance Laser Doppler flowmetry Skin color reflectance 1:0.09 1:0.09 1:0.12 1:0.15':1: 1:0.115 (9%) (16%) (11%) (14%) (30%) 1:0.10 1:0.10 1:0.12' 1:0.18'$ 1:0.095 (21%) (22%) (22%) (15%) (16%) 1:0.08 1:0.09 1:0.11 1:0.16'$ 1:0.085 (0%) (16%) (21%) (55%) (0%) 1:0.08 1:0.09 1:0.14'$ 1:0.16' 1:0.095 (0%) (16%) (68%) (58%) (16%) 1:0.09 1:0.11 1:0.16'$ 1:0.18' 1:0.14' (16%) (20%) (36%) (15%) (21%) Mean molar ratios are derived from the data of six panelists. Coefficients of variation are shown in parenthesis. * Significant difference at p 0.05 level from Day 2 within each evaluation method. $ Significant difference at p 0.05 level from previous day within each evaluation method. Table V Comparison of Mean Molar Ratios of 1.0% SLS:SLEC-5 or -13 Inducing •50% of the SLS Value as Assessed by Five Evaluation Methods Day 2 Day 3 Day 4 Day 5 Day 8 Erythema scores SLEC-5 1:0.09 1:0.13' 1:0.15' 1:0.18 1:0.17' SLEC- 13 1:0.09 1:0.09 1:0.12 1:0.15 1:0.11 TEWL SLEC-5 1:0.10 1:0.16' 1:0.20' 1:0.28' 1:0.09 SLEC- 13 1:0.10 1:0.10 1:0.12 1:0.18 1:0.09 Electrical conductance SLEC-5 1:0.08 1:0.09 1:0.14' 1:0.15 1:0.08 SLEC- 13 1:0.08 1:0.09 1:0.11 1:0.16 1:0.08 Laser Doppler flowmetry SLEC-5 1:0.08 1:0.15 1:0.21 1:0.34' 1:0.16' SLEC- 13 1:0.08 1:0.09 1:0.14 1:0.16 1:0.09 Skin color reflectance SLEC-5 1:0.10 1:0.27' 1:0.30 1:0.40' 1:0.28' SLEC- 13 1:0.09 1:0.11 1:0.16 1:0.18 1:0.14 Mean molar ratios are derived from the data of six panelists. * Significant difference at p 0.05 level between SLEC-5 and SLEC-13 on each particular day within each particular evaluation method. SKIN COLOR REFLECTANCE MEASUREMENTS In the group of panelists treated with mixtures of SLS and SLEC-5 (Table III), the mean molar ratio inducing •50% of the SLS value dropped precipitously from 1:0.10 on Day 2, to 1:0.27 on Day 3, 1:0.30 on Day 4, and 1:0.40 on Day 5. On Day 8, the ratio of 1:0.28 was still significantly different from the Day 2 ratio.

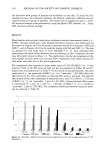
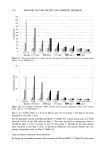
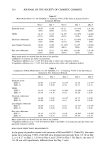
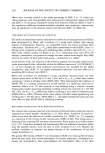
ASSESSING REDUCTION OF SLS IRRITATION 325 Table VI Correlation Coefficients Between Evaluation Methods Erythema Electrical scores TEWL conductance Laser Doppler flowrnetry Skin color reflectance Eythema • 0.48* scores (p 0.0172) TEWL 0.83$ • (p 0.0001) Electrical 0.675 0.553 conductance (p 0.0003) (p 0.0055) Laser Doppler 0.613 0.483 flowmerry (p 0.0017) (p 0.0168) Skin color 0.763 0.783 reflectance (p 0.0001) (p 0.0001) 0.32* (p 0. 1268) 0.72* (p 0.0001) 0.773 (p 0.0001) 0.683 (p 0.0002) 0.39* (p 0.0564) 0.46* (p 0.0241) 0.37* (p 0.0731) 0.773 (p 0.000 0.50* (p 0.0138) 0.38* (p 0.0651) 0.29* (p 0.1665) 0.94* (p 0.0001) Values represent Pearson correlation coefficients. * Correlation coefficient for SLS/SLEC-5 treated group. 3 Correlation coefficient for SLS/SLEC-13 treated group. For the panelists treated with SLS and SLEC-13 (Table IV), skin response •50% of the SLS value was caused on Day 2 by a mean molar ratio of 1:0.09. The ratio decreased steadily to 1:0.11 on Day 3, 1:0.16 on Day 4, and 1:0.18 on Day 5. The mean molar ratio of 1:0.14 on Day 8 was still significantly different from the Day 2 ratio. Statistical differences were found between the two groups-of panelists on Days 3, 5, and 8 (Ta- ble V). DISCUSSION APPROACHES TO IRRITANCY TESTING OF SURFACTANT MIXTURES CONTAINING SLS Skin irritation potential of SLS as measured by various instrumental methods has been most commonly assessed by means of a single application for a 24-hour period (14, 16, 17). At 1.0% to 5.0% concentrations under occlusion, SLS causes drastic irri- tation. These conditions generally are not optimal for demonstrating reduction of SLS irritancy by the addition of milder surfactants. Shorter and repeated exposures of ap- propriate SLS concentrations that induce a step-wise progression of irritation (18-20), together with the use of multiple evaluation methods, appear to have the requisite sensitivity for such testing. A rangefinding study (20) using a test design combining 0.25%, 0.5%, and 1.0% aqueous SLS solutions with one-, two-, and four-hour occlu- sive patch applications on five consecutive days indicated that a two-hour patch exposure with 1.0% SLS would provide suitable experimental conditions. In both the rangefind- ing and the 1.0% SLS:SLEC-5 or -13 mixture studies, a dramatic increase of all the assessment parameters of skin irritancy occurred on Day 3 at the SLS-treated sites in all panelists. Addition of SLEC-5 or -13 to 1.0% SLS delayed the irritation response to Day 4 or 5, thus showing reduced irritancy.
Purchased for the exclusive use of nofirst nolast (unknown)
From: SCC Media Library & Resource Center (library.scconline.org)