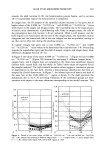
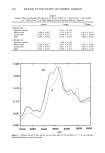
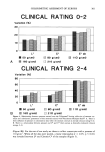
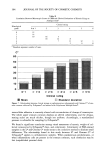
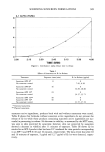
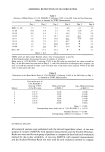
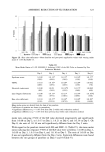
316 JOURNAL OF THE SOCIETY OF COSMETIC CHEMISTS LASER DOPPLER FLOWMETRY MEASUREMENTS A laser Doppler flowmeter (PeriFlux © PF3, Perimed, Stockholm, Sweden) was used for measuring the cutaneous blood flow (14). The laser Doppler probe was attached to the skin without pressure using a probe holder (Perimed, Stockholm, Sweden) held in place by a double-faced adhesive tape (Double-Stick Disc ©, 3M, St. Paul, MN). The instru- mental output was expressed in dimensionless blood flow values. The laser Doppler flowmeter was connected to a computer that recorded the mean blood flow value over a period of 20 seconds. SKIN COLOR REFLECTANCE MEASUREMENTS Skin color reflectance measurements were performed with the Minolta Chroma Meter © CR-200 (Minolta Camera Co., Ltd., Osaka, Japan). Measurements were taken in the L*a*b* three-dimensional color coordinate system recommended by the Commission Internationale de l'Eclairage (CIE) in 1976. In this study, a* values (i.e., measurements on the red-green axis) were used for assessment of erythema (15). Measurements were made in duplicate and the mean value was calculated. DATA REDUCTION SYSTEM A data reduction system was devised to handle the large number of data points (over 3000 for each group of six panelists). The data was expressed as mean molar ratios of 1.0% SLS:SLEC-5 or -13 that induced •50% of the SLS value on each test day and for each evaluation method. The mean molar ratios were derived as follows: a. For each evaluation method and each panelist, the baseline values (initial values measured on Day 1 prior to patch application) were subtracted from the values measured on each day. b. For each panelist and on each day, the first molar ratio of 1.0% SLS:SLEC-5 or -13 (i.e., ratio containing the greatest amount of SLEC-5 or -13) that induced •50% of the SLS value was selected. An example of the selection of the molar ratios inducing •50% of the SLS value for one particular subject and one particular evaluation method is presented in Table I. The data reduction system started with the Day 2 values, since a single SLS patch application did not induce sufficient skin response to discriminate it from sites patched with the various molar ratios. When an erythema score •2 was clinically observed, patching of 1.0% SLS was discontinued. The last measured value was used on all subsequent days for calcu- lation. c. The selected molar ratios were then converted to 1og•o molar percentages of SLEC-5 or -13. d. For each evaluation method and for each day, the mean of the logarithmic values for the six panelists was computed and converted back to a mean molar ratio value (in subsequent text and tables this is referred to as mean molar ratio). e. A coefficient of variation was calculated for each mean molar ratio by taking the antilog of the standard deviation of the logarithmic values, subtracting 1 from it and multiplying the obtained number by 100. Steps c, d, and e of the data reduction system are illustrated by an example in Table II.

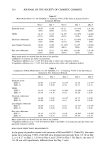
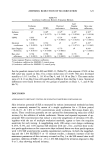
ASSESSING REDUCTION OF SLS IRRITATION 317 Table I Selection of Molar Ratios of 1.0% SLS:SLEC-5 Inducing •50% of the SLS Value for One Particular Subject as Assessed by TEWL Measurements Day 1 Day 2 Day 3 Day 4 Day 5 Day 8 SLEC-5 1.6% 1.3 1.7 3.4 6.8 6.3 1.5 1:1.00 0.8 1.8 3.5 7.8 11.8 2.7 1:0.50 0.9 2.4 5.1 14.9 17.6 2.9 1:0.25 1.5 3.5 10.1 22.6 26.7 4.6 1:0.17 1.6 4.4 15.8 39.1 41.0 14.0 1:0.13 1.8 7.6 21.5 46.7 • 2.3 1:0.10 1.2 5.0 27.8 48.9 • 2.2 1:0.08 1.2 5.6 26.3 53.4 • 3.5 -- SLS 1.0% 2.1 17.5 52.2 • • 3.1 SLS/2 = 8.8 26.1 TEWL values are daily values-Baseline values. Unit of measurement is g/m2/hr. • Patching procedure discontinued because of evidence of irritation. Molar ratios of 1.0% SLS:SLEC-5 inducing •50% of the SLS value are underlined the value recorded on Day 3 at the SLS-treated site was used on Days 4, 5, and 8 for calculation of subsequent days' response the ratio of 1:0.08 was selected on Days 2 and 8 because none of the molar ratios induced •50% of the SLS value on these particular days. Table II Derivation of the Mean Molar Ratio of 1.0% SLS:SLEC-5 Inducing •50% of the SLS Value on Day 3 as Assessed by TEWL Measurements First molar ratio of 1.0% SLS:SLEC-5 inducing • 50% Molar percentage log •o Molar percentage Subject of the SLS value of SLEC-5 of SLEC-5 1 1:0.17 14.29 1.1549 2 1:0.17 14.29 1. 1549 3 1:0.10 9.09 0.9586 4 1:0.17 14.29 1. 1549 5 1:0.17 14.29 1. 1549 6 1:0.25 20.00 1.3010 Mean = 1.1465 Corresponding mean molar ratio of 1.0% SLS:SLEC-5 = 1:0.16 Standard deviation = 0.1091 Corresponding coefficient of variation = 29% STATISTICAL ANALYSIS All statistical analyses were performed with the derived logarithmic values. A one-way analysis of variance (ANOVA) with repeated measurements and the Student-Newman- Keuls test were used for each group of panelists to compare the data from each evaluation method for day-to-day variability. A two-way ANOVA with repeated measurements and the Student-Newman-Keuls test were used for each evaluation method to compare
Purchased for the exclusive use of nofirst nolast (unknown)
From: SCC Media Library & Resource Center (library.scconline.org)