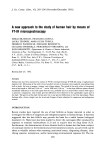
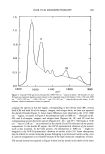
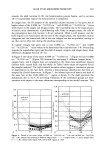
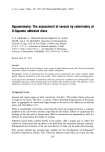
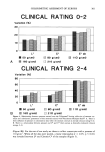
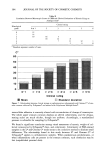
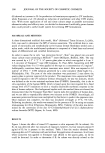
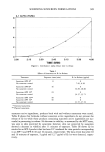
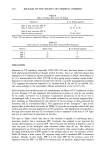
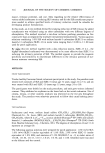
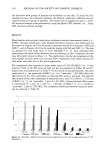
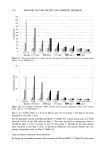
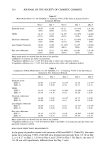
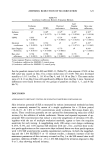
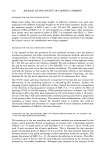
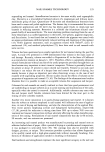
318 JOURNAL OF THE SOCIETY OF COSMETIC CHEMISTS the data from both groups of panelists for variability on each day. To study the rela- tionship between two evaluation methods, the Pearson correlation coefficient was cal- culated within each group of panelists. The chosen level of significance was p 0.05. All statistical analyses were performed by using the Quick CSS © (StatSoft, Inc., Tulsa, OK) statistical software package. RESULTS Mean baseline and post-patch application erythema scores and instrumental values (i. e., TEWL, electrical conductance, laser Doppler flowmetry and skin color reflectance) are illustrated in Figures 1A-E for the group of panelists treated with mixtures of SLS and SLEC-5, and in Figures 2A-E for the panelists treated with SLS and SLEC-13. The data are grouped for each molar ratio of 1.0% SLS:SLEC-5 or -13, with individual bars representing the mean values obtained prior to patching on Day ! (baseline) and one hour after patch removal on Days 1-5. The graphs show a day-by-day progression of the skin response for each molar ratio and also allow comparison of the values obtained for each molar ratio after one to five patch applications. The transformed data expressed as mean molar ratios of 1.0% SLS:SLEC-5 or -13 that induced •50% of the SLS value on each test day are presented in Tables III and IV, respectively, and summarized in Table V. In this system of data presentation, the mean molar ratio (i.e., the proportion of SLEC-5 or -13 to "neutralize" 1.0% SLS) reflects the effectiveness of the ether carboxylate in reducing SLS irritancy potential. The greatest effectiveness of the ether carboxylate is represented by a ratio of 1:0.08 (i.e., 0.08 part of SLEC-5 or -13 can "neutralize" ! part of !.0% SLS), whereas the least effectiveness is represented by a ratio of 1:!.00 (i.e., !.00 part of SLEC-5 or -!3 is needed to "neutralize" ! part of !.0% SLS). The correlation coefficients between evaluation meth- ods are reported in Table VI. 2.5 • 2 0.5 o SLS1.0% 1:0.08 1'010 1:0.13 1:0.17 1:0.25 1'050 1'1.00 SLEC-51.6% • Baseline • Day 1 • Day 2 • Day 3 • Day 4 • Day 5 Figure 1A. Erythema--Mean baseline and post-patch application scores with varying molar ratios of 1.0% SLS:SLEC-5.

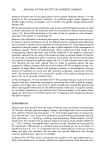
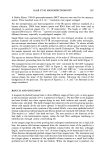
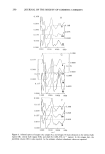
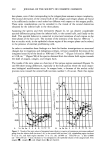
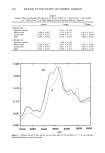
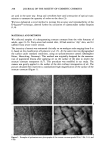
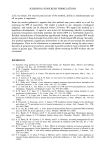
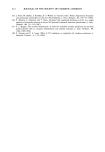
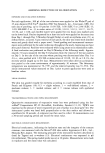
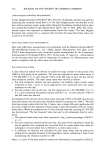
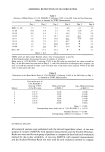
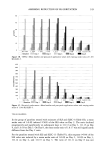
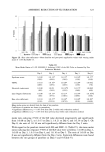
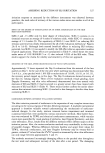
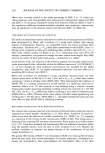
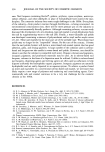
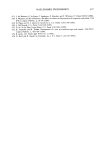
ASSESSING REDUCTION OF SLS IRRITATION 319 30 SLS 1.0% 1 0 08 Baseline :½• Day 1 I 1 0 10 1 ' 0 13 1 ß 0 17 1 ' 0 25 1 ß 0 50 1 ß 1 00 SLEC-5 1 6% ,' • Day 2 %• Day 3 • Day 4 • Day 5 Figure lB. TEWL--Mean baseline and post-patch application values with varying molar ratios of 1.0% SLS:SLEC-5. 1 lOO lOOO 9oo 8oo 03 700 c- • 600 o 500 ._ E 4o0 300 2OO lOO SLS 1.0% 1 ß 0.08 1 '010 0.13 1'017 1 '0.25 1 .050 1 ' 1 00 SLEC-5 1 6% •__J Baseline • Day 1 • Day 2 ,• Day 3 • Day 4 • Day 5 Figure 1C. Electrical conductance•Mean baseline and post-patch application values with varying molar ratios of 1.0% SLS:SLEC-5. VISUAL GRADING In the group of panelists treated with mixtures of SLS and SLEC-5 (Table III), a mean molar ratio of 1:0.09 induced •50% of the SLS value on Day 2. The ratio declined progressively and significantly on subsequent days to 1:0.13 on Day 3, 1:0.15 on Day 4, and 1:0.18 on Day 5. On Day 8, the mean molar ratio of 1:0.17 was still significantly different from the Day 2 ratio. For the panelists treated with SLS and SLEC-13 (Table IV), skin response •50% of the SLS value was induced by a mean molar ,ratio of 1:0.09 on Day 2, 1:0.09 on Day 3, 1:0.12 on Day 4, and 1'0.15 on Day 5. The ratio of 1:0.11 on Day 8 was not
Purchased for the exclusive use of nofirst nolast (unknown)
From: SCC Media Library & Resource Center (library.scconline.org)