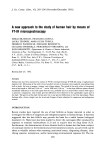
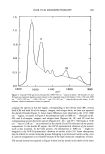
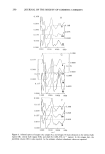
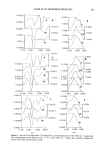
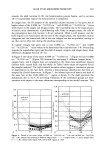
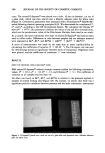
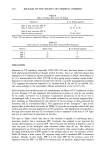
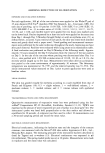
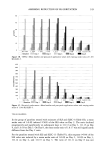
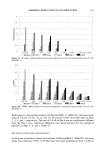
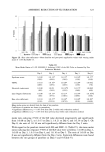
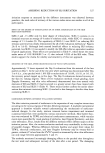
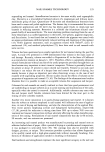
HAIR FT-IR MICROSPECTROSCOPY 291 0.0028 -0.0023 -0.0075 0.0059 0.0018 -0.0009 -0.00:•5 1130 1100 1050 -0.0071 -0.0201 lOOO o.oo C' •'- -0.0015 __ -0.0052 \ , 0.0027 -0.0021 .-O.00G8 i 1130 0.0037 -0.0018 -0.0073 1 lOO 0.0035 -0.0008 1050 1000 lB • 0.003• -0.001G -0.0052 -0.0065 _ z z 1130 1100 1050 1000 Clll- I Clll- l 0.045 --- A 0.023 $ -- 0.000 0.056 --- CI 0.028 0.000 1140 1050 1000 0.032 0.016 0.000 ...... 0.062 c 0.100 0.031 _ 0.000 ø'ø5ø I/•-•l 0.096 0.000 L___,• ...... '•---• 0.043 0.186 [-//• i• 0.093 I/ ...... '••- o.ooo o.ooo r... 1140 1050 1000 0.048 [-----/• .T' 0.024 •/ //•---•- ] 0.034 0.000 t-/• .... x•_ _x• 0.017 0.032[ .... -••- 0.000 0 000 I , 1140 1050 1000 Figure 4. Spectra of (A) anagen hair, (C) catagen hair, and (T) telogen hair (1140-1000 cm- 1 region) and the corresponding second derivatives (A', C', T') (! 130-1000 cm-1 region). EC, epithelial column IB, inferior bulb CB, central bulb S, shaft.

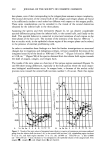
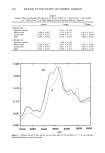
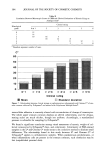
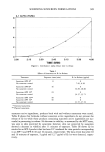
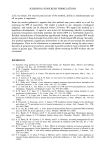
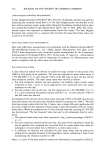
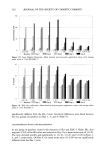
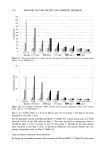
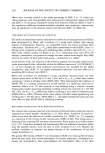
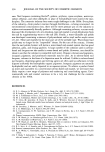
292 JOURNAL OF THE SOCIETY OF COSMETIC CHEMISTS hair phases, even if that corresponding to the telogen phase assumes a major complexity. The second derivatives of the central bulb of the catagen and telogen phases are found to be sufficiently similar to each other but different with respect to the anagen profile. These same considerations can be extended to the trends of the second derivatives obtained for the inferior bulb in the three phases. Analyzing the spectra and their derivatives (Figure 4), we can observe considerable spectral differences going from the inferior bulb, to the central bulb, and finally to the shaft. This spectral behavior is connected to structural variations of each region in the three phases of the hair cycle. The increase of the intensity of the band at 1080 cm- t, due to nucleic acids, in the epithelial column region of the catagen phase can be related to the presence of external proliferating cells. In order to rationalize these findings as a basis for further investigations on structural changes due to exogenous and endogenous stresses, we have considered the ratios of the integrated areas (A) of the bands at 1080 and 1540 cm- t (Figure 5A) and at 1080 and at 1238 cm- • (Figure 5B) of the spectra obtained from the inferior bulb region towards the shaft of anagen, catagen, and telogen hairs. The trends of the ratio values as a function of the various regions examined (Figures 5A and 5B) show strong differences, especially in the bulb portion where the most impor- tant biological modifications occur. In anagen hairs, a decrease of the nucleic acids/ proteins ratio toward the central bulb (sections number 1-8) occurs. From this region 0,35 '• 0,3 •C E 0,2 • A la 3a 5a 2 4 6 8 10 12 14 B la 3a 5a 2 4 6 8 10 12 14 Figure 5. Trends of the ratio values of integrated areas relative to spectra of contiguous microareas analyzed going from the inferior bulb (sections 1-4), to the central bulb (sections 5-8), suprabulbar region (sections 9-12 or 14), and shaft region (sections 13 or 15). (A): (A1080 cm-•)/(A1540 cm-•) (B): (A1080 cm-•)/(A1238 cm-•) ratio. Sections la-5a correspond to the epithelial column of the catagen bulb. Two anagen (O), catagen (I), and telogen hairs (&) are reported.
Purchased for the exclusive use of nofirst nolast (unknown)
From: SCC Media Library & Resource Center (library.scconline.org)